Best Data Viz of 2023

Looking for a fun (if somewhat geeky) study/work break? Check out these best-of lists for 2023:

New York Times

Visual Capitalist

538/ABC News

FlowingData

To see past data tips, click HERE.


Let’s talk about YOUR data!

Got the feeling that you and your colleagues would use your data more effectively if you could see it better? Data Viz for Nonprofits (DVN) can help you get the ball rolling with an interactive data dashboard and beautiful charts, maps, and graphs for your next presentation, report, proposal, or webpage. Through a short-term consultation, we can help you to clarify the questions you want to answer and goals you want to track. DVN then visualizes your data to address those questions and track those goals.


Top 10 Tips of 2023

Here are the top ten reader favorites in case you missed them . . .

To see past data tips, click HERE.


Let’s talk about YOUR data!

Got the feeling that you and your colleagues would use your data more effectively if you could see it better? Data Viz for Nonprofits (DVN) can help you get the ball rolling with an interactive data dashboard and beautiful charts, maps, and graphs for your next presentation, report, proposal, or webpage. Through a short-term consultation, we can help you to clarify the questions you want to answer and goals you want to track. DVN then visualizes your data to address those questions and track those goals.


Upcoming Data Viz Workshops


Let’s talk about YOUR data!

Got the feeling that you and your colleagues would use your data more effectively if you could see it better? Data Viz for Nonprofits (DVN) can help you get the ball rolling with an interactive data dashboard and beautiful charts, maps, and graphs for your next presentation, report, proposal, or webpage. Through a short-term consultation, we can help you to clarify the questions you want to answer and goals you want to track. DVN then visualizes your data to address those questions and track those goals.


Nonprofits Need This Dashboard

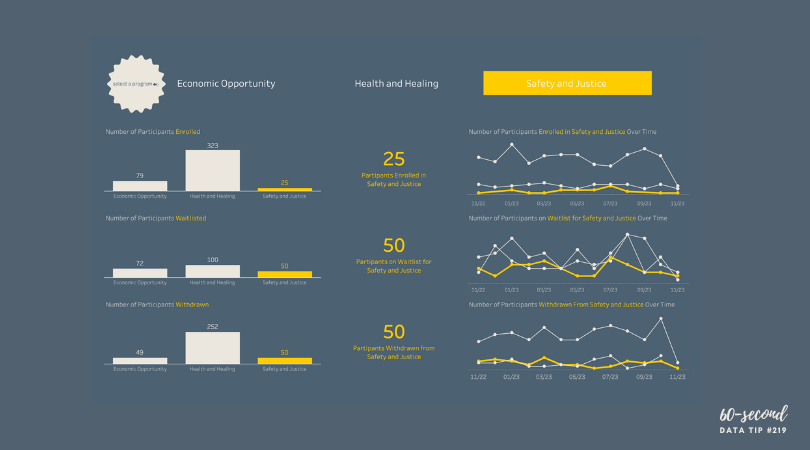
Does your nonprofit have participants (or volunteers or clients or human beings of another sort) in various programs? If so, you could benefit from a dashboard like this one (see below). Give it a spin. Select a program at the top to highlight participants in that program in the charts. This dashboard allows for easy comparisons across programs, across statuses (e.g. enrolled, waitlisted, and withdrawn), and across time. Scroll over charts to learn more.

My inspiration for this dashboard came from Eve Thomas at The Data School. Check out Eve’s article, which includes instructions for creating this type of dashboard with Tableau (assuming basic Tableau knowledge.)


Let’s talk about YOUR data!

Got the feeling that you and your colleagues would use your data more effectively if you could see it better? Data Viz for Nonprofits (DVN) can help you get the ball rolling with an interactive data dashboard and beautiful charts, maps, and graphs for your next presentation, report, proposal, or webpage. Through a short-term consultation, we can help you to clarify the questions you want to answer and goals you want to track. DVN then visualizes your data to address those questions and track those goals.


Ideas You Should Steal From This Viz (Installment 10)

Here’s another steal-worthy viz to inspire you. There’s so much I like about this data dashboard created by Alessia Musìo on Tableau Public. In the Information is Beautiful Awards submission for this dashboard, Musìo notes: “Simplicity, coherence, and clarity are the words that have guided me in the development of the project.”

Here’s what I especially like and suggest you apply to your own dashboards:

  • User friendly: There’s no need for a user guide for this dashboard. The simple left-hand panel tells you all you need to know: how to navigate to other pages, how to filter the data, and how to interpret the color coding.

  • Limited views of data: There are only two ways of looking at the data contained in the dashboard: in a map which allows you to make comparisons across regions and countries or in a chart showing change over time. And there are limited ways to filter the data. This simplicity makes the dashboard more approachable and instantly usable.

  • Methodology and sources page: For those interested, the methods and sources are presented in an organized way with links.

Take the dashboard out for a spin. Be sure to hover over the circular elements on the single country charts to see comparisons with countries of the same continent.


Let’s talk about YOUR data!

Got the feeling that you and your colleagues would use your data more effectively if you could see it better? Data Viz for Nonprofits (DVN) can help you get the ball rolling with an interactive data dashboard and beautiful charts, maps, and graphs for your next presentation, report, proposal, or webpage. Through a short-term consultation, we can help you to clarify the questions you want to answer and goals you want to track. DVN then visualizes your data to address those questions and track those goals.


Data Dashboard Treasure Hunt

Looking for a way to engage your staff, board members, and others in your data dashboard? Want them to understand how to use it and how it can inform their work? Here’s a great idea from MiraCosta College: a dashboard treasure hunt! Each page features one page of the dashboard along with questions that require the user to interact with the dashboard. Correct answers lead the user toward a hidden treasure. Try it for yourself:


Source: Treasure Hunt by MiraCosta College on Tableau Public

To see past data tips, click HERE.


Let’s talk about YOUR data!

Got the feeling that you and your colleagues would use your data more effectively if you could see it better? Data Viz for Nonprofits (DVN) can help you get the ball rolling with an interactive data dashboard and beautiful charts, maps, and graphs for your next presentation, report, proposal, or webpage. Through a short-term consultation, we can help you to clarify the questions you want to answer and goals you want to track. DVN then visualizes your data to address those questions and track those goals.


How to Extract Meaning from Survey Data

You just conducted a survey of your clients. participants, board members, visitors, or community members, and chances are you used some Likert Scales in that survey. In other words, you asked respondents to state their level of agreement or disagreement on a symmetric agree-disagree scale. A typical 5-level Likert scale is:

Strongly Disagree - Disagree - Neither Agree nor Disagree - Agree - Strongly Agree

Here’s a FAQ (which is more like a QYSA: Questions You Should Ask) on visualizing Likert Scale data to extract useful information.

Have you collected data just once or multiple times with this survey?

If this is a one-time deal, then I would suggest that you visualize the data using a stacked bar chart. Exactly which type of stacked bar chart depends on what you are trying to understand and show. Check out this Daydreamming With Numbers blog post: 4 ways to visualize Likert Scales. It walks you through various options. If you have collected the data two or more times, read on.

Should I calculate average scores and compare them?

A common way to look at change over time with Likert Scale data is to assign numerical values to each response (e.g. Strongly Disagree: 1, Disagree: 2, Neither Agree nor Disagree: 3, Agree: 4, Strongly Agree: 5) then calculate the average across respondents at two or more points in time and compare them. Some may even use a statistical test (such as a paired sample t-test) to assess whether the averages are “significantly” different. This may seem like an obvious way to deal with the data, but there are problems with it:

  • The distance between 4 and 5 is always the same as the distance between 2 and 3. However, the distance between Agree and Strongly Agree is not necessarily the same as the distance between Disagree and Neither Agree nor Disagree. So we may be distorting respondents’ opinions and emotions by assigning numbers to these response options.

  • Respondents are often reluctant to express strong opinions and thus gravitate to the middle options. Averaging a bunch of middle options (2, 3, and 4) only amplifies the impression that respondents are on the fence.

  • Averages do not give us a sense of the range of responses. The average of these 4 responses (5,1,1,1) is the same as the average of these 4 responses (2,3,2,1). Also averages result in fractional results which can be hard to interpret. Does an increase from 4.32 to 4.71, even if it’s statistically significant, really mean anything in the real world? At best, we can say that the aggregated results changed from somewhere between Agree and Strongly Agree to another place that is a little closer to Strongly Agree.

What are alternatives to calculating averages?

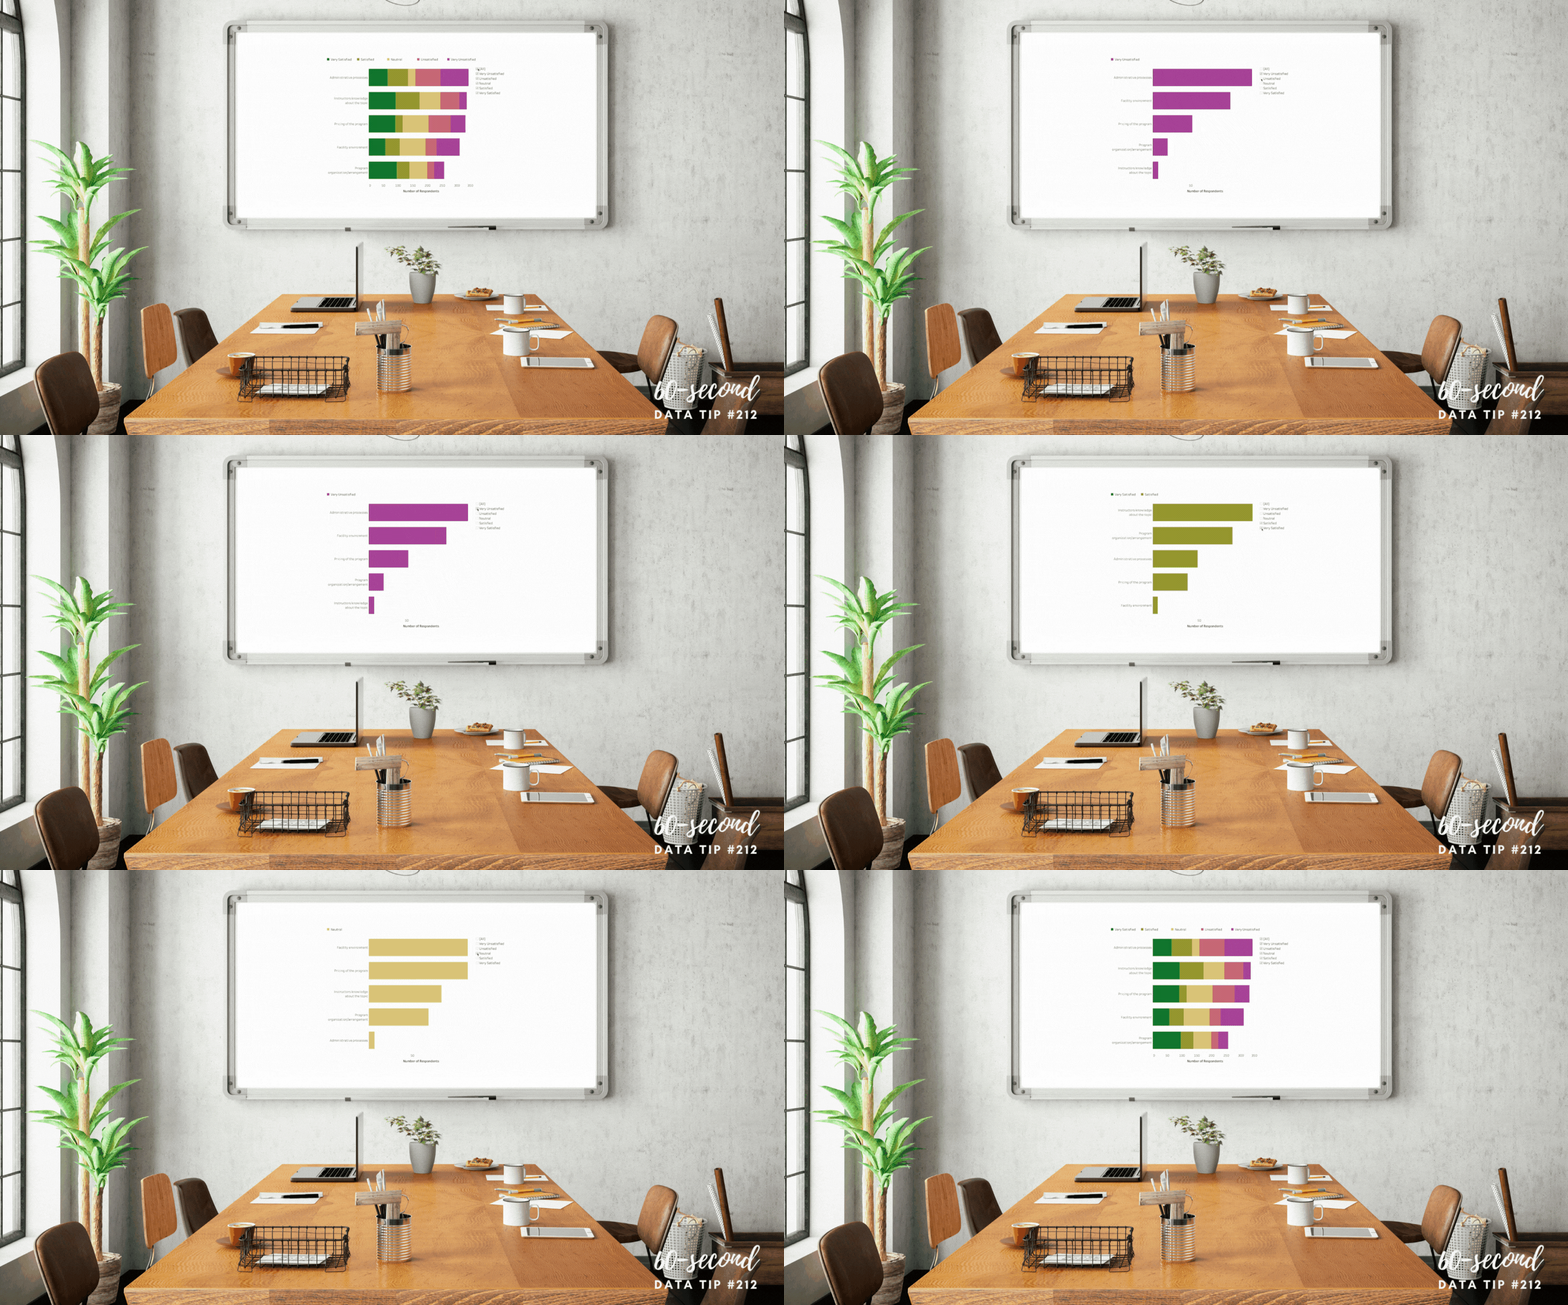
Visualize the spread of responses. If you don’t have too many questions (or can group questions together) some simple side-by-side stacked bar charts might do the trick. See sketch 1 below.

Use the mode or median rather than average.The mode is the number that occurs most often in a data set and may be a good way to describe the data if one response dominated. The median is the middle value when a data set is ordered from least to greatest. If responses tend toward one end of the scale (i.e. are skewed), it may be more reasonable to use the median rather than the average. If you feel that the assumption of equal spacing between response options is legit, then you might stick with the average.

Visualize average, mode, or median using one of the following chart types (see sketches 2-4) to understand and show change over time.

To see past data tips, click HERE.


Let’s talk about YOUR data!

Got the feeling that you and your colleagues would use your data more effectively if you could see it better? Data Viz for Nonprofits (DVN) can help you get the ball rolling with an interactive data dashboard and beautiful charts, maps, and graphs for your next presentation, report, proposal, or webpage. Through a short-term consultation, we can help you to clarify the questions you want to answer and goals you want to track. DVN then visualizes your data to address those questions and track those goals.


New and Improved Stacked Bar Chart

Here’s a simple solution to a problem with stacked bar charts. Yes, they allow you to compare the size of different groups as well as the subgroups within each group. But comparing the subgroups is tough because — for all but one of the subgroups — you have to compare the length of the bar segments without a common baseline.

The bar chart below, created with Tableau, solves that problem by adding a filter so that you can see the whole bars by selecting “All” but also see only one or more subgroups so you can easily make comparisons across just those subgroups. In this chart, I’ve also set the sort order so that it’s always in descending order regardless of the filter selections. See info below on how I set the sort order in Tableau.

See how this chart works by interacting with it yourself! Change the selections on the checkboxes.

To sort questions in descending order regardless of the response option chosen, click the dropdown arrow on Question in the rows shelf and select Sort . . .

. . . .Then choose to sort by Field in descending sort order and choose the name of the field that indicates number of respondents.

To see past data tips, click HERE.


Let’s talk about YOUR data!

Got the feeling that you and your colleagues would use your data more effectively if you could see it better? Data Viz for Nonprofits (DVN) can help you get the ball rolling with an interactive data dashboard and beautiful charts, maps, and graphs for your next presentation, report, proposal, or webpage. Through a short-term consultation, we can help you to clarify the questions you want to answer and goals you want to track. DVN then visualizes your data to address those questions and track those goals.


Ideas You Should Steal From This Viz (Installment 9)

Source: Source: Yusuke Nakanishi on Tableau Public

Here’s another steal-worthy viz to inspire you. This one is from Yusuke Nakanishi on Tableau Public. Filling the numbers to show the percent is cool, particularly because the chart is about drinking and the numbers appear to be filled like a glass. Nakanishi created the chart in Tableau by making a simple bar chart and then placing a virtual stencil (i.e. numbers with a transparent fill) over the chart. The best place to make this type of stencil is probably Adobe Illustrator. But if you don’t have an Adobe subscription, you can do it for free in Canva. I created this image in Canva as indicated below.

  1. Open Canva and click on “Create a design” in upper right corner of the screen. Select a size (I chose presentation).

  2. Select “Background” on left side of screen and then choose a background.

  3. Select “Elements” on left side of screen and enter' “number frames” in the search window. Number frames look like numbers filled with an illustration of grass and sky. Click on the numbers you want and place and size them on the slide as you wish.

  4. Select “Elements” on left side of screen and enter search terms in the search window to find a photo with one color on the bottom and another color on the top. I entered “oil” and used a photo with oil on the bottom and white on the top.

  5. Drag that image over each number frame until it fills the frame.

  6. Double click on the filled number and resize and move the image until the bottom color fills the number frame to the right height. To determine the height, you can use Canva’s rulers and guides.


Let’s talk about YOUR data!

Got the feeling that you and your colleagues would use your data more effectively if you could see it better? Data Viz for Nonprofits (DVN) can help you get the ball rolling with an interactive data dashboard and beautiful charts, maps, and graphs for your next presentation, report, proposal, or webpage. Through a short-term consultation, we can help you to clarify the questions you want to answer and goals you want to track. DVN then visualizes your data to address those questions and track those goals.


Jitter Your Charts

A jittered bar chart shows the individuals that make up the bar. In this example, each circle represents an employee within a given city department. Larger circles represent higher salaries and smaller circles lower salaries. You can scroll over each circle to learn more. It’s another great way to show the individuals within an aggregate. And it’s easy to create in Tableau (just watch this four-minute video) or in Excel (here are instructions).


Let’s talk about YOUR data!

Got the feeling that you and your colleagues would use your data more effectively if you could see it better? Data Viz for Nonprofits (DVN) can help you get the ball rolling with an interactive data dashboard and beautiful charts, maps, and graphs for your next presentation, report, proposal, or webpage. Through a short-term consultation, we can help you to clarify the questions you want to answer and goals you want to track. DVN then visualizes your data to address those questions and track those goals.


Is The Chihuahua Syndrome Infecting Your Data?

This “sketchplanation” gives a name to a familiar problem.* Chihuahua is challenging to spell. If humans are entering dog breeds into a database or spreadsheet, chances are there are going to be spelling errors unless they can select from a list of breeds or there is another sort of data validation. It’s hard to extract meaning from data that is inaccurate. “Capitals, spaces, misspellings, hyphens, numbers stored as text, numbers entered as letters (I, O), accents, straight/curly apostrophes, dates out of order, languages, dialects, abbreviations, and more are all routes for misleading your analysis.” So make a plan to clean your dirty data and to keep it clean over time. Also, when visualizing data in programs like Tableau, you can group common misspellings into one new field. In this way, the misspelled entry will be automatically corrected in visualizations that use the new field. Also, Tableau Prep Builder comes with most subscriptions to Tableau and allows for easier data preparation including combining, shaping, and cleaning data for analysis within Tableau.

To see past data tips, click HERE.

*Chihuahua Syndrome” was coined by Edward Tufte.


Let’s talk about YOUR data!

Got the feeling that you and your colleagues would use your data more effectively if you could see it better? Data Viz for Nonprofits (DVN) can help you get the ball rolling with an interactive data dashboard and beautiful charts, maps, and graphs for your next presentation, report, proposal, or webpage. Through a short-term consultation, we can help you to clarify the questions you want to answer and goals you want to track. DVN then visualizes your data to address those questions and track those goals.


Two Ways to Offer The "Just Right" Data Portion

60-SECOND DATA TIP #8 (3).png

Reposted from June 2018

Pretend that you are Goldilocks and your porridge is data. How much data is just right? Just enough to engage your funders, staff, or board members, but not so much as to be overwhelming?

To answer this question, we might consider Miller’s Law. George A. Miller was a psychology professor at Princeton University and wrote one of the most frequently cited papers in psychology: "The Magical Number Seven, Plus or Minus Two: Some Limits on Our Capacity for Processing Information."

Miller conducted experiments on human memory and concluded that the number of objects that an average human can remember in the short-term is 7 ± 2.  Objects can include symbols like numbers or abstract concepts. We also can hold several groups of related objects in mind.

Armed with this knowledge, we can make visualizations of data (charts, maps, graphs) easier to digest by:

1) Grouping data into categories. Whenever you have a graph or chart with more than 5 data categories, the individual units start to lose their individuality and are perceived by our eyes as a single whole. In the “before” and “after” examples below, the after chart is easier to process because it combines data on donors into just two groups: those in Chicago and those in other cities.

2) Highlight one or two single categories and gray out the rest. The second chart below (called a parallel coordinates chart) includes a line for each of the 50 states showing the prevalence of various diseases in each state. But only one state (Hawaii) is highlighted and the rest are grayed out. Thus there are really only two data categories to compare: 1) Hawaii and 2) the rest of the states.

BEFORE: TOO MANY GROUPS

many groups.jpg

AFTER: JUST TWO GROUPS

two groups.jpg

HIGHLIGHT ONE GROUP

hawaii.jpg

Let’s talk about YOUR data!

Got the feeling that you and your colleagues would use your data more effectively if you could see it better? Data Viz for Nonprofits (DVN) can help you get the ball rolling with an interactive data dashboard and beautiful charts, maps, and graphs for your next presentation, report, proposal, or webpage. Through a short-term consultation, we can help you to clarify the questions you want to answer and goals you want to track. DVN then visualizes your data to address those questions and track those goals.


Context is King

This “sketchplanation” elegantly demonstrates the importance of context in understanding anything. Since data visualizations are supposed to help people understand something, we should pay close attention to context when creating them, adding as much context as is needed for others to appreciate what’s going on and act on it. Considering the following charts . . .

Low-context chart

This is your garden variety chart. I see them all the time. Sure, it provides some context by comparing clients served in different zip code areas. But it doesn’t give me enough context to understand if these numbers are high, low, or somewhere in between. This chart needs more context.

xx

Moderate-context chart

This chart is better than the one above. By providing the previous year’s numbers, we can see where there has been increases and decreases and how large and small they were as well as compare the number increases (3) to the number of decreases (1).

xx

Moderate-context chart

This chart, too, allows for better assessment of the numbers than the first chart did. By simply adding a reference line for the goal, we have a better understanding of what’s going on and where we might need to take action. A reference line showing the average number of clients per zip code might also be helpful.

xx

High-context chart

This “small multiples chart”* gives us much more context by showing how the current numbers compare to past years. Consider, for example, the trend for 60601. Just knowing the current and past years’ numbers would not give you an appreciation of the overall upward trend.

*Small multiples chart: a series of similar graphs or charts using the same scale and axes, allowing them to be easily compared


Let’s talk about YOUR data!

Got the feeling that you and your colleagues would use your data more effectively if you could see it better? Data Viz for Nonprofits (DVN) can help you get the ball rolling with an interactive data dashboard and beautiful charts, maps, and graphs for your next presentation, report, proposal, or webpage. Through a short-term consultation, we can help you to clarify the questions you want to answer and goals you want to track. DVN then visualizes your data to address those questions and track those goals.


Interesting Versus Actionable Data

60-SECOND DATA TIP_4 (3).gif

Reposted from October 2021

It’s easy to get lost in a sea of interesting data when what you really need is actionable data. As Oracle’s Nate Mayfield points out, you know when you’ve presented only interesting data when you get this type of response: “Oh, cool. Yeah, that's great to know.” On the other hand, if you hear “Oh, okay. I can definitely decide what to do now,” then you’ve presented actionable data.

The key to presenting actionable data is to ask specific—rather than broad—questions. And then design your charts, maps, and graphs to answer those narrower questions. Mayfield’s article focuses on the types of questions a business might ask. Let’s consider the types of questions a nonprofit might ask:

Interesting Questions.png

Mayfield notes that data dashboards that are designed for a wide range of users tend to address only interesting questions. “Because they are intended for a broad set of users, with a lot of filters, you can in theory answer a lot of questions with these sprawling dashboards,” says Mayfield. “The problem is people quickly get lost in them and don’t spend the time required to answer their questions.” Instead, Mayfield advises us to create simple dashboards that answer quite specific questions such as the actionable questions above. So consider a series of simple dashboards, each designed to provide answers that prompt action for a particular type of user.

To see past data tips, including tips on other types of pantry staple data, click HERE.


Let’s talk about YOUR data!

Got the feeling that you and your colleagues would use your data more effectively if you could see it better? Data Viz for Nonprofits (DVN) can help you get the ball rolling with an interactive data dashboard and beautiful charts, maps, and graphs for your next presentation, report, proposal, or webpage. Through a short-term consultation, we can help you to clarify the questions you want to answer and goals you want to track. DVN then visualizes your data to address those questions and track those goals.


Ideas You Should Steal From This Viz (Installment 8)

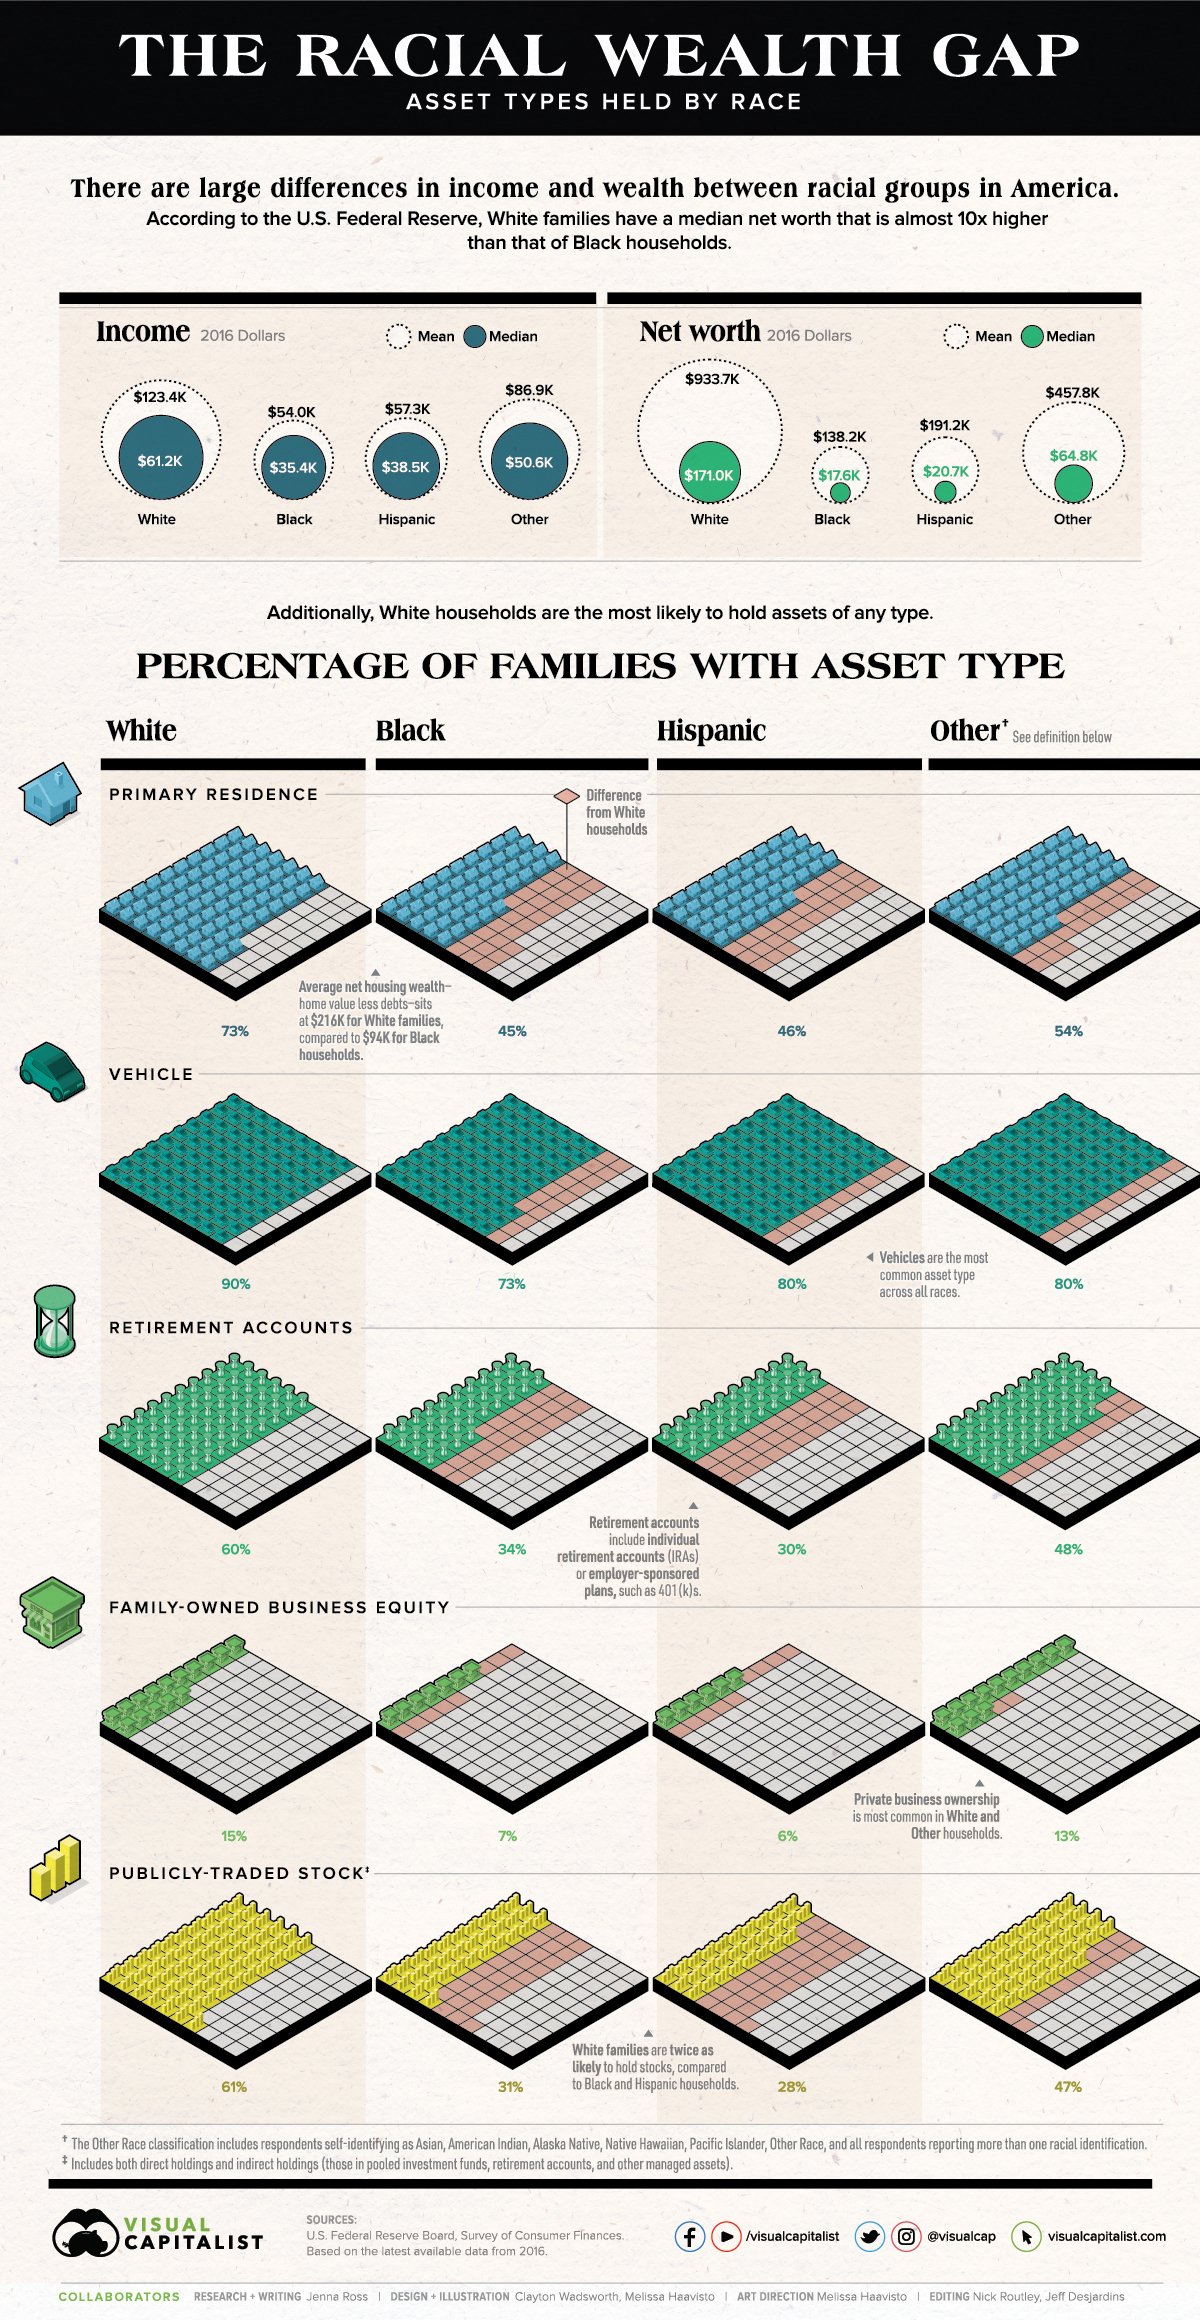
Today I offer up yet another steal-worthy viz. The Racial Wealth Gap viz uses data from the U.S. Federal Reserve’s Survey of Consumer Finances to show the proportion of households that own different kinds of assets by racial group. Here’s what I like about this chart (and what you should steal from it):

  1. The use 100 families in addition to percentages. We can wrap our brains around 100 families. We can imagine it.

  2. The use of icons that help tell the story and also remind us of Monopoly pieces.

  3. Highlighting the gaps between the White group and other racial groups. The pink squares help us to appreciate how large the gaps are and how they compare across different asset groups.

To see past data tips, click HERE.


Let’s talk about YOUR data!

Got the feeling that you and your colleagues would use your data more effectively if you could see it better? Data Viz for Nonprofits (DVN) can help you get the ball rolling with an interactive data dashboard and beautiful charts, maps, and graphs for your next presentation, report, proposal, or webpage. Through a short-term consultation, we can help you to clarify the questions you want to answer and goals you want to track. DVN then visualizes your data to address those questions and track those goals.


Bar Chart Hack #5: A Little Fine-Tuning Can Transform A Chart


Welcome back to the 60-Second Data Tip series, “How to Hack a Bar Chart.” This week we look at some graphical fine-tuning that can transform a traditional bar chart into something that’s more engaging and more informative.

First I’ll show. Then I’ll tell.

Take a look at Chart A below. Then take a look at Chart B.

large_small_data (version 1).jpg

Chart A

voices.png

Chart B


Both are bar charts showing the same data. But B wins, hands down. Why?

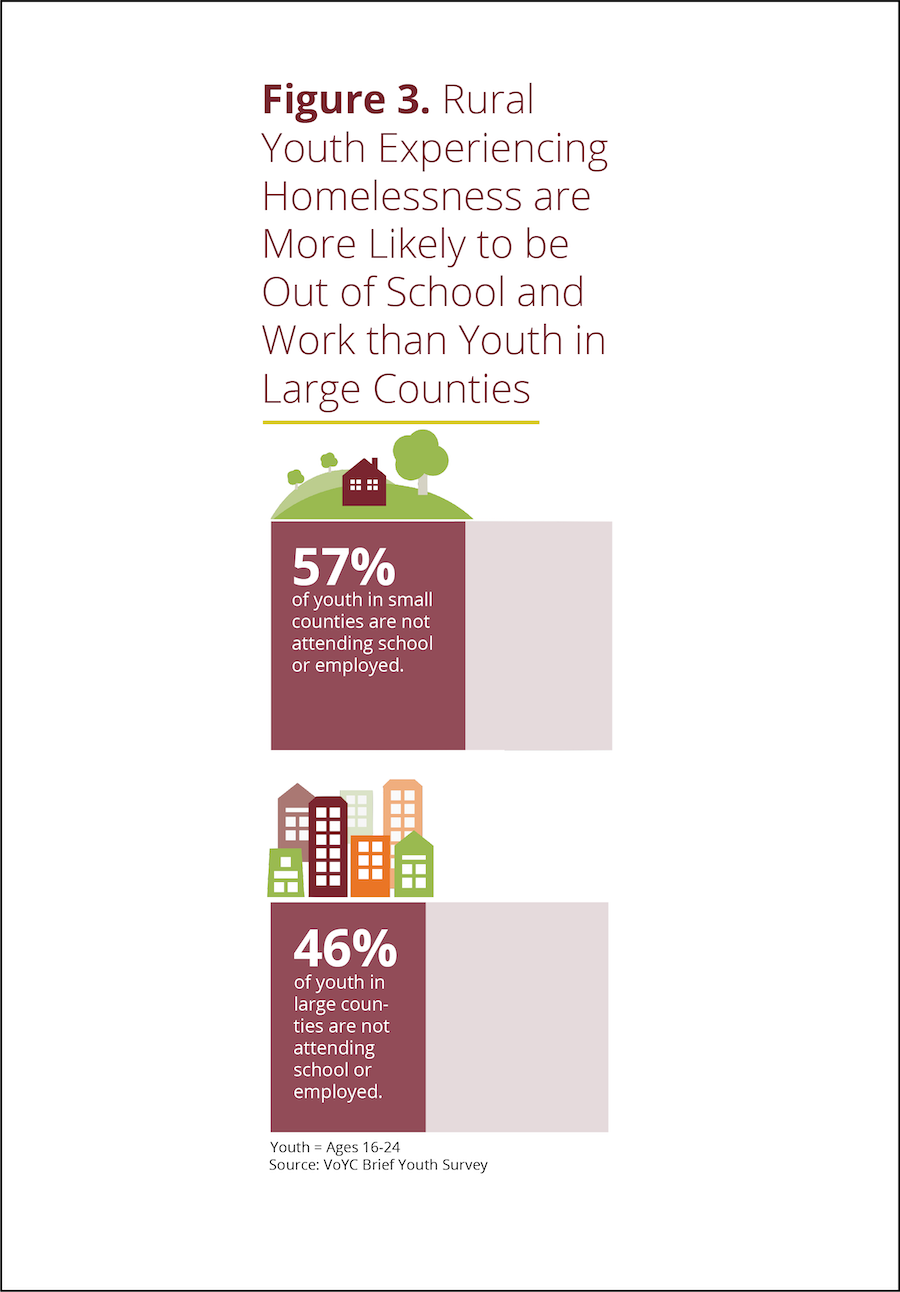
Chart A truncates the Y-axis making the difference between large and small counties look bigger than it actually is. Chart B, by contrast, fills in the whole bar and darkens the portion not attending school or employed, thus giving us a sense of the size of both groups (those who are in and out of school and work) in large and small counties.

Chart B points us to the main takeaway with the title and annotations.

Chart B doesn’t have unnecessary and distracting visual elements such as gridlines and axes labels.

Chart B provides images to further emphasize the contrast between large and small counties.

To see past data tips, click HERE.


Let’s talk about YOUR data!

Got the feeling that you and your colleagues would use your data more effectively if you could see it better? Data Viz for Nonprofits (DVN) can help you get the ball rolling with an interactive data dashboard and beautiful charts, maps, and graphs for your next presentation, report, proposal, or webpage. Through a short-term consultation, we can help you to clarify the questions you want to answer and goals you want to track. DVN then visualizes your data to address those questions and track those goals.


Ideas You Should Steal From This Viz (Installment 7)

Today I offer up yet another steal-worthy viz: Emergency Calls Dashboard created with Tableau by Pradeep Kumar G. This one is genius. It seems to defy basic graphic design rules. It includes many charts and lots of small text and numbers and yet it’s readable and not overwhelming.

As you can see, the charts are contained within four rectangular views, each with the dimensions of a phone screen. Tableau dashboards can include layouts for different types of devices with varying screen sizes. When you publish these layouts, people viewing your dashboard experience a design optimized for their device (phone, tablet, or desktop.)

If you view the Emergency Calls Dashboard with a phone, you will see just one of the four views and can use the icons at the bottom of the screen to navigate to the other views, as shown in the image to the right.

Effective phone layouts usually:

  • Limit a dashboard’s focus and content (you can only get so much on this small canvas),

  • Reduce interactivity (dealing with filters on a phone can be annoying*), and

  • Use a vertical orientation (vertical scrolling is easier than horizontal scrolling).

The Emergency Calls Dashboard has all of these features, so the phone view works quite well. Indeed, these phone views are so effective that they also work when laid out side-by-side in the desktop view.

When building dashboards for multiple device types, dashboard designers often start with the desktop view and then simplify that larger, more detailed design for the phone view. The Emergency Calls Dashboard demonstrates the benefit of beginning with the phone view. If you design a simple, readable phone view that makes effective use of its limited canvas, you can use this design to fit more information in the desktop or tablet layout. Even if you aren’t designing for multiple screen sizes, following the tips for effective phone layouts will serve you well, opening up possibilities for including more data in one view without overwhelming the user.

I’ve embedded the dashboard below so that you can interact with it.

*The Tableau Mobile app optimises filters for phones, making them pop and easier to use. It also allows for logical scrolling, swiping, pinching, and zooming. However, some of your users may not use the app.


Let’s talk about YOUR data!

Got the feeling that you and your colleagues would use your data more effectively if you could see it better? Data Viz for Nonprofits (DVN) can help you get the ball rolling with an interactive data dashboard and beautiful charts, maps, and graphs for your next presentation, report, proposal, or webpage. Through a short-term consultation, we can help you to clarify the questions you want to answer and goals you want to track. DVN then visualizes your data to address those questions and track those goals.


9 Ways to Make Your Data Visualizations Stand Out

Data visualizers from around the world flex their muscles each week by creating charts, maps, and graphs using a common data set. It’s called Makeover Monday. Even if you don’t participate, it’s a great way to see the range of ways a single data set can be visualized and to consider the pros and cons of different approaches. Check out the Makeover Monday site which provides a wealth of information from past Makover Monday challenges including favorite vizes associated with each challenge. The Makeover Monday folks also shared this “Viz Checklist” with the world. And I’m offering it up as this week’s data tip. Use it next time you visualize data to ensure a polished result.

Source: https://www.makeovermonday.co.uk/

To see past data tips, click HERE.


Let’s talk about YOUR data!

Got the feeling that you and your colleagues would use your data more effectively if you could see it better? Data Viz for Nonprofits (DVN) can help you get the ball rolling with an interactive data dashboard and beautiful charts, maps, and graphs for your next presentation, report, proposal, or webpage. Through a short-term consultation, we can help you to clarify the questions you want to answer and goals you want to track. DVN then visualizes your data to address those questions and track those goals.


Best Data Viz of 2022

Looking for a fun (if somewhat geeky) study/work break? Check out these best-of lists for 2022:

New York Times

Toward Data Science

Vox

FiveThirtyEight

FlowingData

To see past data tips, click HERE.


Let’s talk about YOUR data!

Got the feeling that you and your colleagues would use your data more effectively if you could see it better? Data Viz for Nonprofits (DVN) can help you get the ball rolling with an interactive data dashboard and beautiful charts, maps, and graphs for your next presentation, report, proposal, or webpage. Through a short-term consultation, we can help you to clarify the questions you want to answer and goals you want to track. DVN then visualizes your data to address those questions and track those goals.


Ideas You Should Steal From This Viz (Installment 4)

“Every artist gets asked the question: ‘Where do you get your ideas?’ The honest artist answers, ‘I steal them.’ . . . What a good artist understands is that nothing comes from nowhere. All creative work builds on what came before.” —Austin Kleon in Steal Like An Artist.

Today I offer up another steal-worthy interactive viz that I came across in the Tableau Public Gallery. Scroll down for ideas to steal from this viz.


Source: Ethan Lang on Tableau Public


Here’s what I suggest you steal from this viz:

  • Side-by-side comparisons. It’s simple to compare states to one another since they are arrayed alongside each other.

  • Good news/bad news colors. The red/blue color coding makes it easy to discern states with decreased rates of homelessness from those with increased rates both in the national map and in the individual state charts.

  • Easy look up. If you want to dig into one state’s data, you can select it on the map and get more detail on the charts in the upper left hand panel.

To see past data tips, click HERE.


Let’s talk about YOUR data!

Got the feeling that you and your colleagues would use your data more effectively if you could see it better? Data Viz for Nonprofits (DVN) can help you get the ball rolling with an interactive data dashboard and beautiful charts, maps, and graphs for your next presentation, report, proposal, or webpage. Through a short-term consultation, we can help you to clarify the questions you want to answer and goals you want to track. DVN then visualizes your data to address those questions and track those goals.