Behold the Heated Bar Chart

I’ve come across this useful chart a number of times and have yet to find a name for it. So I’m giving it one: the heated bar chart. If a bar chart and a heat map had a baby, it might look like this and be even more powerful than its useful parents. This heated bar chart shows months along the horizontal axis and days of the week along the vertical axis. Darker and longer bars on the two bar charts and darker cells on the heat map show when there has been the highest participation in hours. This allows us to examine patterns in participation. We can see, for example, that the relatively high participation in May is being driven by participation on Mondays during that month but that Monday was not a particularly high participation day during other months. We can also see that, overall, participation was lower during the fall months, regardless of day of the week.

This powerful combo chart can be used with many different types of data fields. For example, you might want to create one showing the number of participants from different gender identity and age groups to see if certain gender groups within certain age brackets are not well represented among your participants.

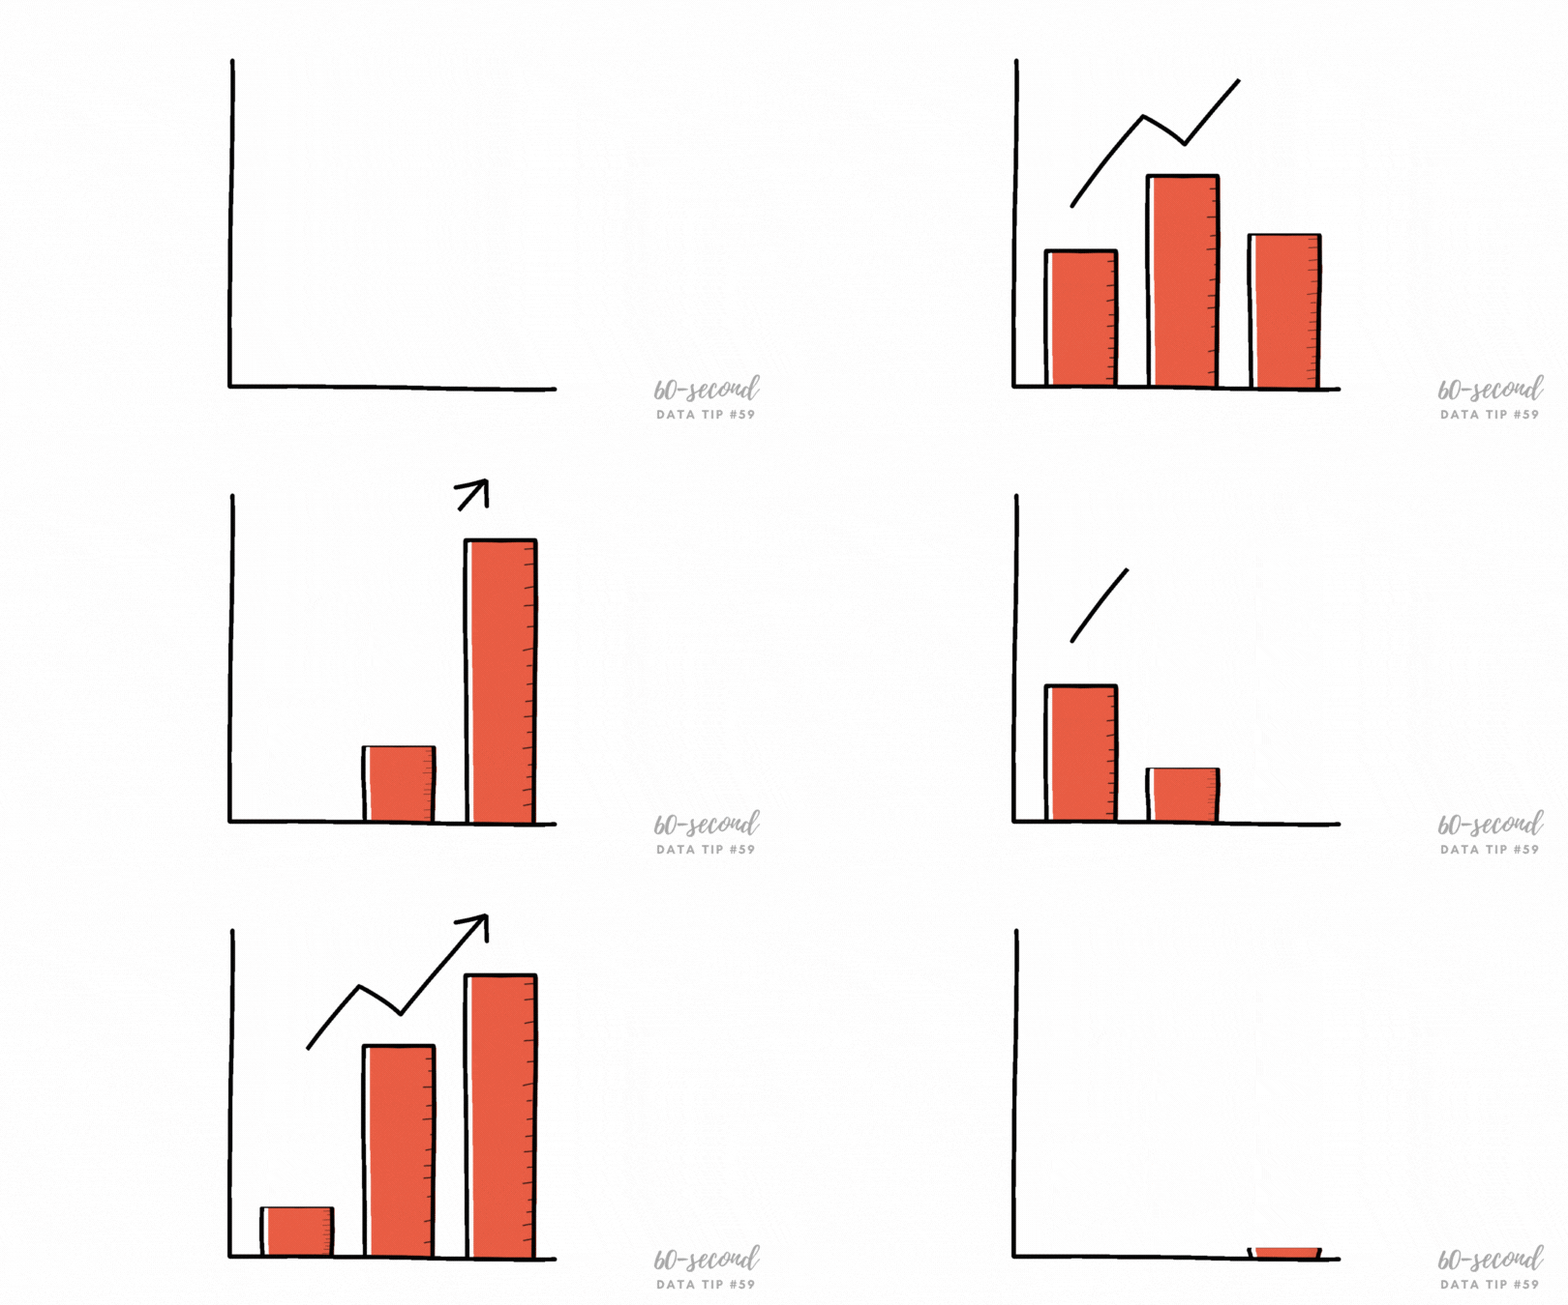
I made this chart with Tableau Public, the free version of Tableau. But this type of chart can be created with any number of applications. For those of you with at least a little Tableau know-how, check out the steps I took in the comic strip below.


Let’s talk about YOUR data!

Got the feeling that you and your colleagues would use your data more effectively if you could see it better? Data Viz for Nonprofits (DVN) can help you get the ball rolling with an interactive data dashboard and beautiful charts, maps, and graphs for your next presentation, report, proposal, or webpage. Through a short-term consultation, we can help you to clarify the questions you want to answer and goals you want to track. DVN then visualizes your data to address those questions and track those goals.


New and Improved Stacked Bar Chart

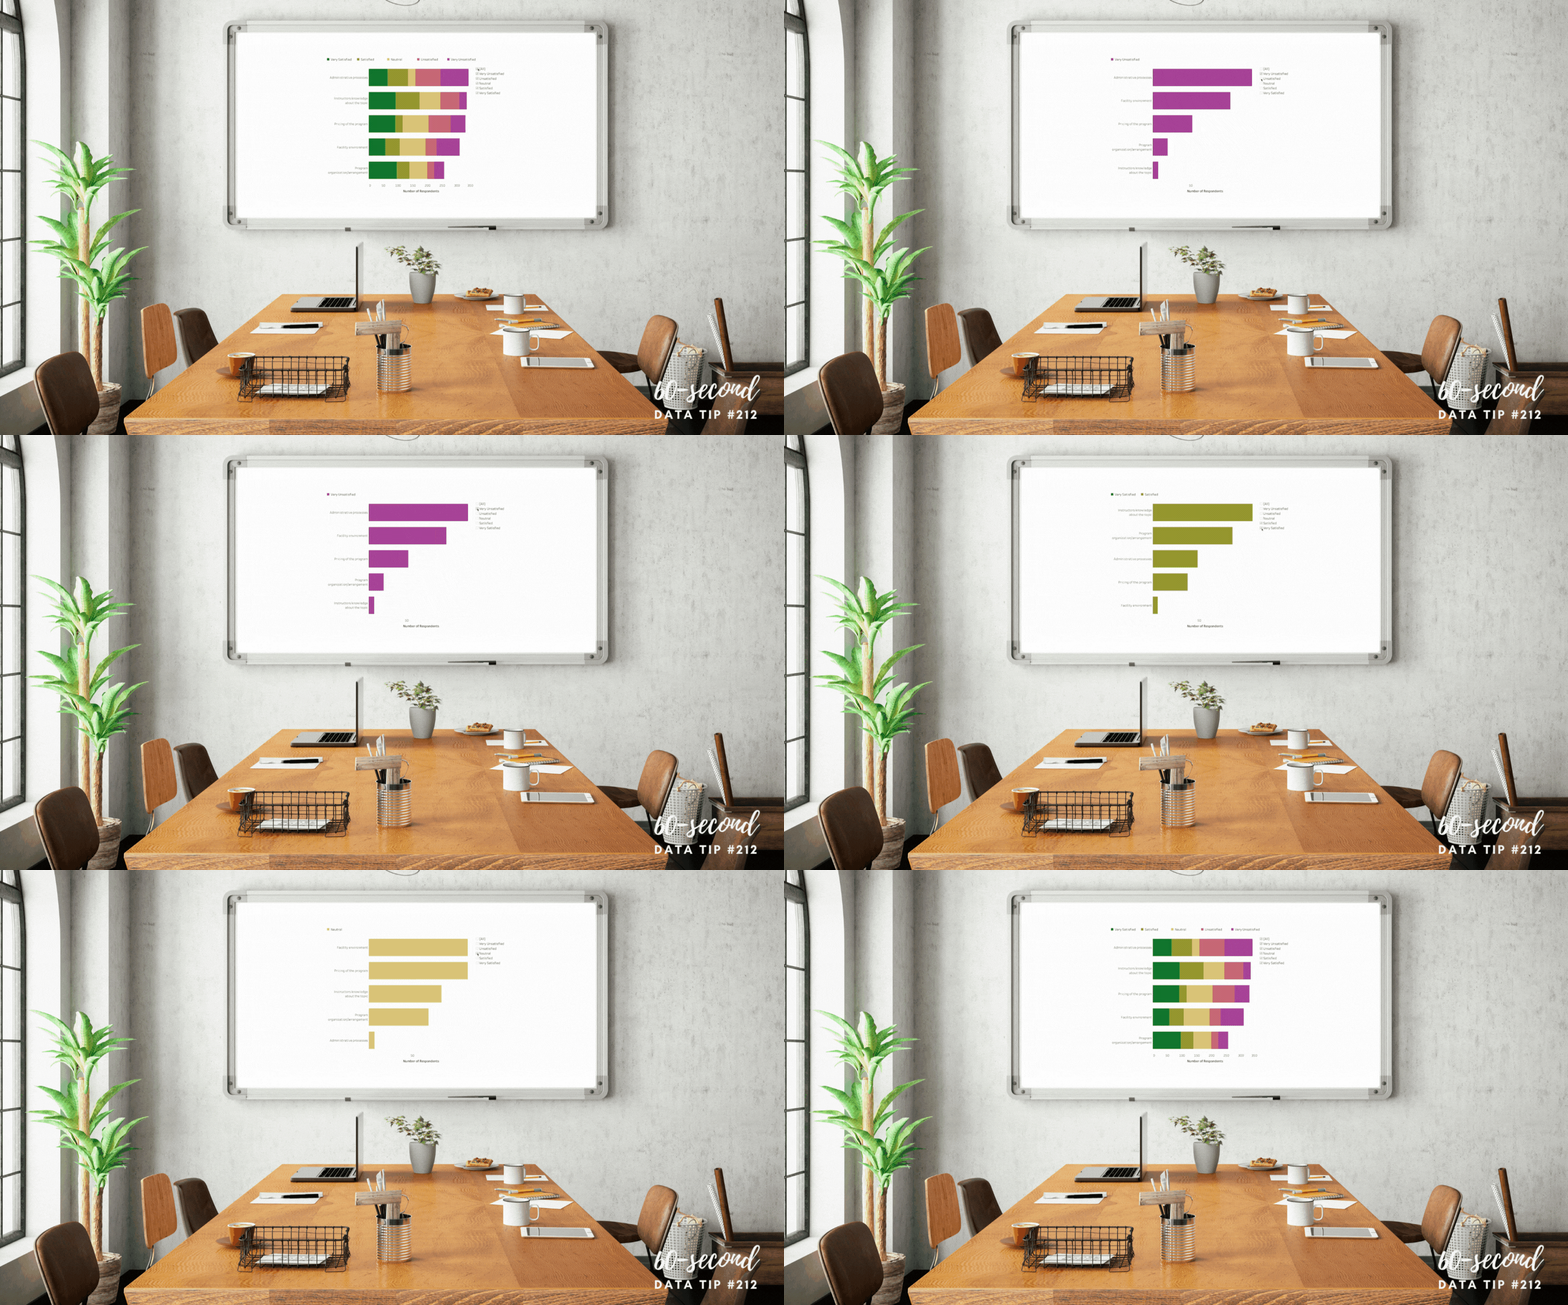
Here’s a simple solution to a problem with stacked bar charts. Yes, they allow you to compare the size of different groups as well as the subgroups within each group. But comparing the subgroups is tough because — for all but one of the subgroups — you have to compare the length of the bar segments without a common baseline.

The bar chart below, created with Tableau, solves that problem by adding a filter so that you can see the whole bars by selecting “All” but also see only one or more subgroups so you can easily make comparisons across just those subgroups. In this chart, I’ve also set the sort order so that it’s always in descending order regardless of the filter selections. See info below on how I set the sort order in Tableau.

See how this chart works by interacting with it yourself! Change the selections on the checkboxes.

To sort questions in descending order regardless of the response option chosen, click the dropdown arrow on Question in the rows shelf and select Sort . . .

. . . .Then choose to sort by Field in descending sort order and choose the name of the field that indicates number of respondents.

To see past data tips, click HERE.


Let’s talk about YOUR data!

Got the feeling that you and your colleagues would use your data more effectively if you could see it better? Data Viz for Nonprofits (DVN) can help you get the ball rolling with an interactive data dashboard and beautiful charts, maps, and graphs for your next presentation, report, proposal, or webpage. Through a short-term consultation, we can help you to clarify the questions you want to answer and goals you want to track. DVN then visualizes your data to address those questions and track those goals.


And Here's A Bonus: A Bar Chart Catalogue

I thought I had wrapped up my miniseries on bar charts when I came across this excellent bar chart catalogue by Rosa Mariana de Leon-E. It includes 27 variations on the bar chart with links to instructions for creating them with Tableau. Enjoy!


Let’s talk about YOUR data!

Got the feeling that you and your colleagues would use your data more effectively if you could see it better? Data Viz for Nonprofits (DVN) can help you get the ball rolling with an interactive data dashboard and beautiful charts, maps, and graphs for your next presentation, report, proposal, or webpage. Through a short-term consultation, we can help you to clarify the questions you want to answer and goals you want to track. DVN then visualizes your data to address those questions and track those goals.


Bar Chart Hack #7: The Lollipop Chart

Reposted from February 2019

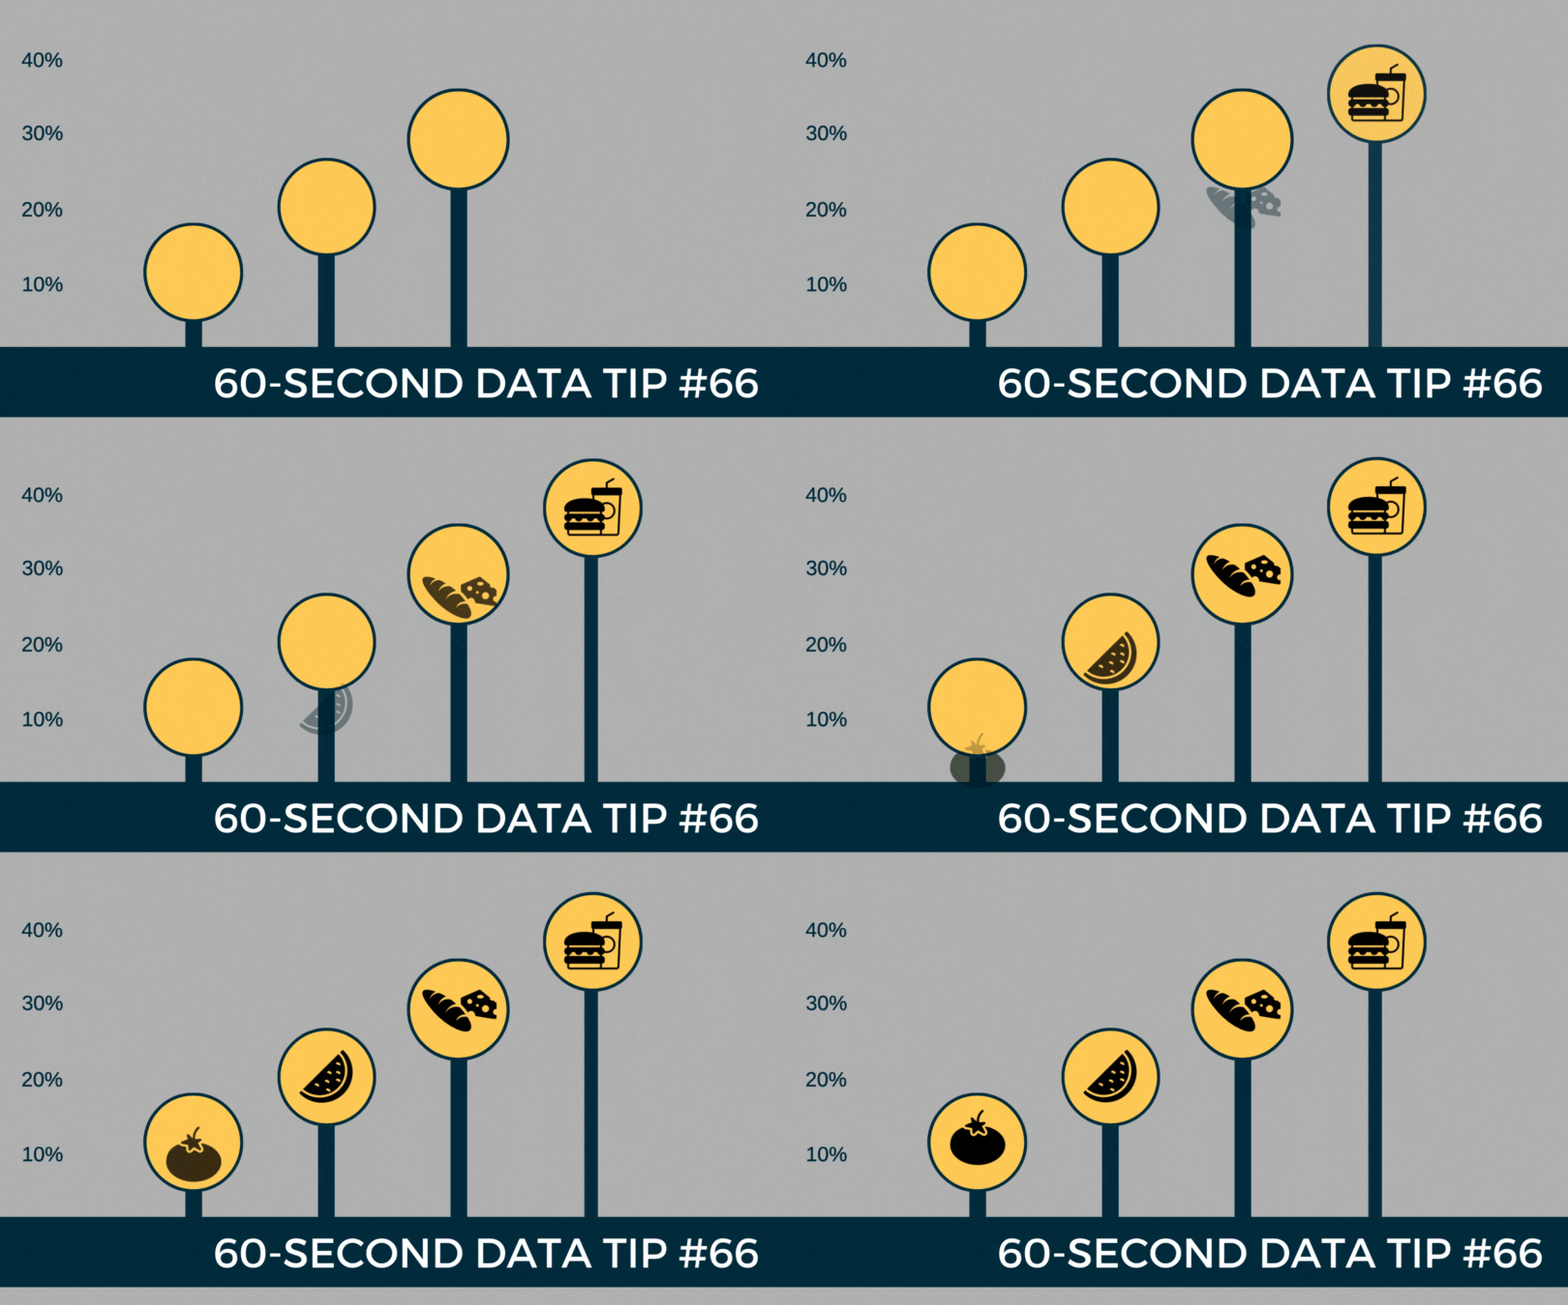
The lollipop chart provides a short and sweet addition to the 60-Second Data Tip series, “How to Hack a Bar Chart.”

A lollipop chart is nothing more than thin bars with circles on top. So why go to the trouble? Well, if you have a lot of bars of similar length, you should not go to the trouble. The circles will just make comparing the lengths of the bars more difficult.

But the lollipop chart can be helpful when you have a bunch of bars of varying lengths, and you want to set them apart in a visually interesting way. Also, you can use those circles as labels, as in the example above.

Check out these easy instructions for making lollipop charts in Tableau and Excel.

To see past data tips, click HERE.

Icons created by Ben Davis, Dinosoft Labs, and andrewcaliber from Noun Project.


Let’s talk about YOUR data!

Got the feeling that you and your colleagues would use your data more effectively if you could see it better? Data Viz for Nonprofits (DVN) can help you get the ball rolling with an interactive data dashboard and beautiful charts, maps, and graphs for your next presentation, report, proposal, or webpage. Through a short-term consultation, we can help you to clarify the questions you want to answer and goals you want to track. DVN then visualizes your data to address those questions and track those goals.


Bar Chart Hack #5: A Little Fine-Tuning Can Transform A Chart


Welcome back to the 60-Second Data Tip series, “How to Hack a Bar Chart.” This week we look at some graphical fine-tuning that can transform a traditional bar chart into something that’s more engaging and more informative.

First I’ll show. Then I’ll tell.

Take a look at Chart A below. Then take a look at Chart B.

large_small_data (version 1).jpg

Chart A

voices.png

Chart B


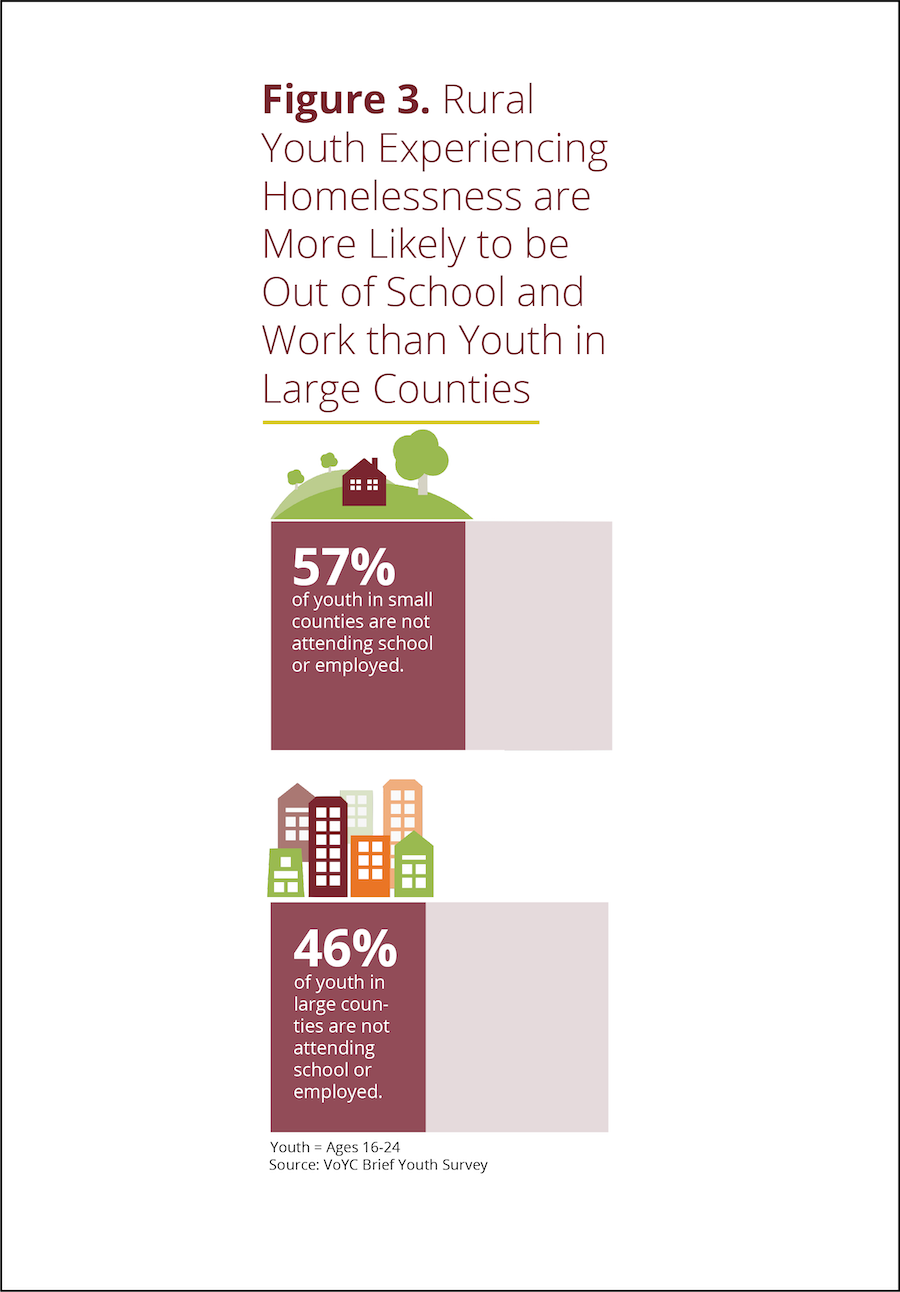
Both are bar charts showing the same data. But B wins, hands down. Why?

Chart A truncates the Y-axis making the difference between large and small counties look bigger than it actually is. Chart B, by contrast, fills in the whole bar and darkens the portion not attending school or employed, thus giving us a sense of the size of both groups (those who are in and out of school and work) in large and small counties.

Chart B points us to the main takeaway with the title and annotations.

Chart B doesn’t have unnecessary and distracting visual elements such as gridlines and axes labels.

Chart B provides images to further emphasize the contrast between large and small counties.

To see past data tips, click HERE.


Let’s talk about YOUR data!

Got the feeling that you and your colleagues would use your data more effectively if you could see it better? Data Viz for Nonprofits (DVN) can help you get the ball rolling with an interactive data dashboard and beautiful charts, maps, and graphs for your next presentation, report, proposal, or webpage. Through a short-term consultation, we can help you to clarify the questions you want to answer and goals you want to track. DVN then visualizes your data to address those questions and track those goals.


Bar Chart Hack #4: Radial Charts

3.png

Reposted from February 2019

Welcome to Episode 3 of “How to Hack a Bar Chart.” This time we consider two bar chart subspecies that recast the regular bar chart in circular form. They may be eye-catching but be careful how you use them.

1.png

Radial Column Chart: (aka Circular Column Graph or Star Graph). As you can see in the example above, the bars on this chart are plotted on a grid of concentric circles, each representing a value on a scale. Usually, the inner circles represent lower values and values increase as you move outward. Sometimes each bar is further divided using color to show subgroups within each category. Because we are better at assessing length along a common scale, this type of chart isn’t ideal if you want viewers to accurately compare the lengths of each bar. However, these charts are great at showing cyclical patterns. Florence Nightingale used this type of chart (which she called a “polar area chart”) to show a cyclical pattern in the number and causes of death in the Crimean War.

This work is in the public domain in its country of origin and other countries and areas where the copyright term is the author's life plus 70 years or less.

2.png

Radial Bar Chart (aka Circular Bar Chart) is simply a bar chart in which the bars curve around a circle, like runners on a circular track. As you may recall, races on circular or oval running tracks include staggered starting lines so that runners on the outer (longer) tracks run the same distance as those on the inner (shorter) tracks. But the bars on a radial chart have the same starting line making it difficult to compare lengths. So skip the radial bar chart. Not worth the effort.

To see past data tips, click HERE.


Let’s talk about YOUR data!

Got the feeling that you and your colleagues would use your data more effectively if you could see it better? Data Viz for Nonprofits (DVN) can help you get the ball rolling with an interactive data dashboard and beautiful charts, maps, and graphs for your next presentation, report, proposal, or webpage. Through a short-term consultation, we can help you to clarify the questions you want to answer and goals you want to track. DVN then visualizes your data to address those questions and track those goals.


Bar Chart Hack #3: The Combo Chart

60-SECOND DATA TIP_3.png

Reposted from January 2019

Welcome to another episode in the 60-Second Data Tip series, “How to Hack a Bar Chart.” As we have discussed, bar charts are user-friendly and familiar, but like all things familiar, they can be boring and easy-to-ignore. This week we consider—in about 30 seconds— how to combine a bar chart with another type of chart to wake us up and engage us.

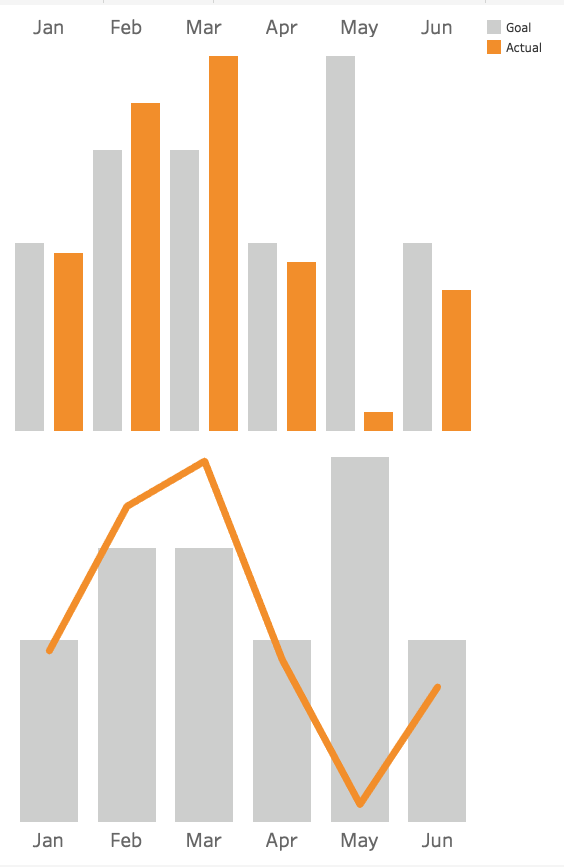
Consider the two charts below. Both show the same data: fundraising goals vs. actual funds raised. The one on top uses bars for both categories. The bottom one uses bars for the goals and lines for actual amounts.

Which works better? I vote for the bottom one. It makes comparing values between two different categories easier because it uses not only different colors to distinguish them but different “encodings” (bars and lines).  The bottom chart gives us a clear view of when we are exceeding or falling short of our goals in any given month.

combo chart image.png

To see past data tips, click HERE.


Let’s talk about YOUR data!

Got the feeling that you and your colleagues would use your data more effectively if you could see it better? Data Viz for Nonprofits (DVN) can help you get the ball rolling with an interactive data dashboard and beautiful charts, maps, and graphs for your next presentation, report, proposal, or webpage. Through a short-term consultation, we can help you to clarify the questions you want to answer and goals you want to track. DVN then visualizes your data to address those questions and track those goals.


Bar Chart Hack #2: The Icon Bar Chart

60-SECOND DATA TIP_3.png

Reposted from January 2019

Welcome to Episode 2 of “How to Hack a Bar Chart.” This mini-series shows you how to take something that works well and that folks understand and move it in a more creative and engaging direction. This time, you meet a close cousin of the bar chart, but this cousin is more interesting than its relative. It has icons.

This is what you should NOT do with icons: make them into bars. Here’s why: bar charts are powerful (if boring) because we can easily compare their lengths. When icons or images are used in place of bars, such comparisons are more difficult to make. See the first example below showing how many clients live in different types of homes. It’s quite a challenge to determine how many more clients live in suburban homes vs. high rises. That’s because the height of the icons are difficult to assess.

2.png

The second example makes it a little easier. But I’d argue that in both examples 1 and 2, the icons make the viewer’s job (comparing lengths) unnecessarily difficult.

3.png

The third example, introduces bars back into the bar chart and thus requires minimal viewer effort.

60-SECOND+DATA+TIP_3+%281%29.jpg

And the fourth further lightens the load by removing the Y-axis and directly labeling the bars and placing the bars closer together.

5.jpg

To see past data tips, click HERE.

Image credits: House by ANTON icon from the Noun Project, company by Angriawan Ditya Zulkarnain from the Noun Project, Farm by Ferran Brown from the Noun Project


Let’s talk about YOUR data!

Got the feeling that you and your colleagues would use your data more effectively if you could see it better? Data Viz for Nonprofits (DVN) can help you get the ball rolling with an interactive data dashboard and beautiful charts, maps, and graphs for your next presentation, report, proposal, or webpage. Through a short-term consultation, we can help you to clarify the questions you want to answer and goals you want to track. DVN then visualizes your data to address those questions and track those goals.


Bar Chart Hack #1: The Divergent Stacked Bar Chart

60-SECOND DATA TIP.png

Reposted from January 2019

Last week I promised to arm you with useful bar chart hacks. The idea is to take something that works well and that folks understand but move it in a more creative and interesting direction.

So this week I give to you: The Divergent Stacked Bar Chart.

Okay, so you know what a bar chart is. And you probably know what a stacked bar chart is, even if you don’t call it that. It uses color to show the subgroups that comprise each bar (or larger group) in the chart like this:

bar.png

Regular Stacked Bar Chart

Now the cool, or divergent, part. It’s easier to show you than to describe it. So take a look:

returnstohomelessness.jpg

Divergent Stacked Bar Chart

As you can see, the the divergent chart aligns each bar around a common midpoint. So it’s much easier to compare, for example, positive and negative values across categories.

Stephanie Evergreen provides directions on making a divergent stacked bar chart in Excel. And here are instructions on creating such a chart in Tableau. Other data viz softwares can make this chart too.

For a much deeper dive into the data viz world’s debate over when and if to use divergent stacked bar charts, check out this article by Daniel Zvinca.

To see past data tips, click HERE.


Let’s talk about YOUR data!

Got the feeling that you and your colleagues would use your data more effectively if you could see it better? Data Viz for Nonprofits (DVN) can help you get the ball rolling with an interactive data dashboard and beautiful charts, maps, and graphs for your next presentation, report, proposal, or webpage. Through a short-term consultation, we can help you to clarify the questions you want to answer and goals you want to track. DVN then visualizes your data to address those questions and track those goals.


How To Hack A Bar Chart

Reposted from January 2019

Choosing a chart type is like making breakfast for your kids. Bar charts are Cheerios. You know they will eat it and it’s healthy. Now come the buts:

But #1:  Cheerios is boring and you wish they had a wider palate.

But #2: If you give them a quinoa breakfast bowl, it will go uneaten and you might as well have given them Cheerios.

When it comes to data visualization, Maarten Lambrechts says don't settle for Cheerios. He calls the problem “xenographobia” or the fear of weird charts. And he implores us to boost our viewers’ “graphicacy” by feeding them the equivalents of quinoa breakfast bowls in the chart world.

Here’s what I think. We should neither spook our children at breakfast time nor our funders, board members, and staff throughout the day. But we should try to slowly widen their palates. One way to do that is to take something they know and love and hack it a bit. Throw some nuts on the Cheerios. Use color in novel ways to enliven a bar chart.

Over the next several weeks, I will offer up different ways to hack a bar chart. Stay tuned!

To see past data tips, click HERE.


Let’s talk about YOUR data!

Got the feeling that you and your colleagues would use your data more effectively if you could see it better? Data Viz for Nonprofits (DVN) can help you get the ball rolling with an interactive data dashboard and beautiful charts, maps, and graphs for your next presentation, report, proposal, or webpage. Through a short-term consultation, we can help you to clarify the questions you want to answer and goals you want to track. DVN then visualizes your data to address those questions and track those goals.


Bar Chart Hack #7: The Lollipop Chart

60-SECOND DATA TIP_3.png

The lollipop chart provides a short and sweet ending to the 60-Second Data Tip series, “How to Hack a Bar Chart.”

A lollipop chart is nothing more than thin bars with circles on top. So why go to the trouble? Well, if you have a lot of bars of similar length, you should not go to the trouble. The circles will just make comparing the lengths of the bars more difficult.

But the lollipop chart can be helpful when you have a bunch of bars of varying lengths, and you want to set them apart in a visually interesting way. Also, you can use those circle as labels, as in the example above.

Check out these easy instructions for making lollipop charts in Tableau and Excel.

And, before we leave bar chart hacks altogether, check out this wonderful animated bar chart showing the GDP of various countries over time. Watch China fall and rise! (And thanks to my friend, Harry Gottlieb, for sharing this chart with me.)

See other data tips in this series for more information on how to effectively visualize and make good use of your organization's data. 

Icons created by Ben Davis, Dinosoft Labs, and andrewcaliber from Noun Project.

Bar Chart Hack #4: Radial Charts

3.png

Welcome to Episode 3 of “How to Hack a Bar Chart.” This time we consider two bar chart species that recast the regular bar chart in circular form. They may be eye-catching but be careful how you use them.

1.png

Radial Column Chart: (aka Circular Column Graph or Star Graph). As you can see in the example above, the bars on this chart are plotted on a grid of concentric circles, each representing a value on a scale. Usually, the inner circles represent lower values and values increase as you move outward. Sometimes each bar is further divided using color to show subgroups within each category. Because we are better at assessing length along a common scale, this type of chart isn’t ideal if you want viewers to accurately compare the lengths of each bar. However, these charts are great at showing cyclical patterns. Florence Nightingale used this type of chart (which she called a polar area chart) to show a cyclical pattern in the number and causes of death in the Crimean war.
This work is in the public domain in its country of origin and other countries and areas where the copyright term is the author's life plus 70 years or less.


2.png

Radial Bar Chart (aka Circular Bar Chart) is simply a bar chart in which the bars curve around a circle, like runners on a circular track. As you may recall, races on circular or oval running tracks include staggered starting lines so that runners on the outer (longer) tracks run the same distance as those on the inner (shorter) tracks. But the bars on a radial chart have the same starting line making it difficult to compare lengths. So skip the radial bar chart. Not worth the effort.

See other data tips in this series for more information on how to effectively visualize and make good use of your organization's data. 

Bar Chart Hack #3: The Combo Chart

60-SECOND DATA TIP_3.png

Welcome to another episode in the 60-Second Data Tip series, “How to Hack a Bar Chart.” As we have discussed, bar charts are user-friendly familiar but like all things familiar, they can be boring and easy-to-ignore. This week we consider—in about 30 seconds— how to combine a bar chart with another type of chart to wake us and engage us.

Consider the two charts below. Both show the same data: fundraising goals vs. actual funds raised. The one on top uses bars for both categories. The bottom one uses bars for the goals and lines for actual amounts.

Which works better? I vote for the bottom one. It makes comparing values between two different categories easier because it uses not only different colors to distinguish them but different “encodings” (bars and lines).  The bottom chart gives us a clear view of when we are exceeding or falling short of our goals in any given month.

See other data tips in this series for more information on how to effectively visualize and make good use of your organization's data. 

combo chart image.png

Bar Chart Hack #2: The Icon Bar Chart

60-SECOND DATA TIP_3.png

Welcome to Episode 2 of “How to Hack a Bar Chart.” This mini-series shows you how to take something that works well and that folks understand and move it in a more creative and engaging direction. This time, you meet a close cousin of the bar chart, but this cousin is more interesting than its relative. It has icons.

This is what you should NOT do with icons: make them into bars. Here’s why: bar charts are powerful (if boring) because we can easily compare their lengths. When icons or images are used in place of bars, such comparisons are more difficult to make. See the first example below showing how many clients live in different types of homes. It’s quite a challenge to determine how many more clients live in suburban homes vs. high rises. That’s because the height of the icons are difficult to assess.

2.png

The second example makes it a little easier. But I’d argue that in both examples 1 and 2, the icons make the viewer’s job (comparing lengths) unnecessarily difficult.

3.png

The third example, introduces bars back into the bar chart and thus requires minimal viewer effort.

60-SECOND+DATA+TIP_3+%281%29.jpg

And the fourth further lightens the load by removing the Y-axis and directly labeling the bars and placing the bars closer together.

5.jpg

See other data tips in this series for more information on how to effectively visualize and make good use of your organization's data. 

Image credits: House by ANTON icon from the Noun Project, company by Angriawan Ditya Zulkarnain from the Noun Project, Farm by Ferran Brown from the Noun Project

Bar Chart Hack #1: The Divergent Stacked Bar Chart

60-SECOND DATA TIP.png

Last week I promised to arm you with useful bar chart hacks. The idea is to take something that works well and that folks understand but move it in a more creative and interesting direction.

So this week I give to you: The Divergent Stacked Bar Chart.

Okay, so you know what a bar chart is. And you probably know what a stacked bar chart is, even if you don’t call it that. It uses color to show the subgroups that comprise each bar (or larger group) in the chart like this:

bar.png

Regular Stacked Bar Chart

Now the cool, or divergent, part. It’s easier to show you than to describe it. So take a look:

returnstohomelessness.jpg

Divergent Stacked Bar Chart

As you can see, the the divergent chart aligns each bar around a common midpoint. So it’s much easier to compare, for example, positive and negative values across categories.

Stephanie Evergreen provides directions on making a divergent stacked bar chart in Excel. And here are instructions on creating such a chart in Tableau. Other data viz softwares can make this chart too.

For a much deeper dive into the data viz world’s debate over when and if to use divergent stacked bar charts, check out this article by Daniel Zvinca.

See other data tips in this series for more information on how to effectively visualize and make good use of your organization's data. 


How To Hack A Bar Chart

60-SECOND DATA TIP (1).png

Choosing a chart type is like making breakfast for your kids. Bar charts are Cheerios. You know they will eat it and it’s healthy. Now come the buts:

But #1:  Cheerios is boring and you wish they had a wider palate.

But #2: If you give them a quinoa breakfast bowl, it will go uneaten and you might as well have given them Cheerios.

When it comes to data visualization, Maarten Lambrechts says don't settle for Cheerios. He calls the problem “xenographobia” or the fear of weird charts. And he implores us to boost our viewers’ “graphicacy” by feeding them the equivalents of quinoa breakfast bowls in the chart world.

Here’s what I think. We should neither spook our children at breakfast time nor our funders, board members, and staff throughout the day. But we should try to slowly widen their palates. One way to do that is to take something they know and love and hack it a bit. Throw some nuts on the Cheerios. Use color in novel ways to enliven a bar chart.

Over the next several weeks, I will offer up different ways to hack a bar chart. Stay tuned!

See other data tips in this series for more information on how to effectively visualize and make good use of your organization's data.