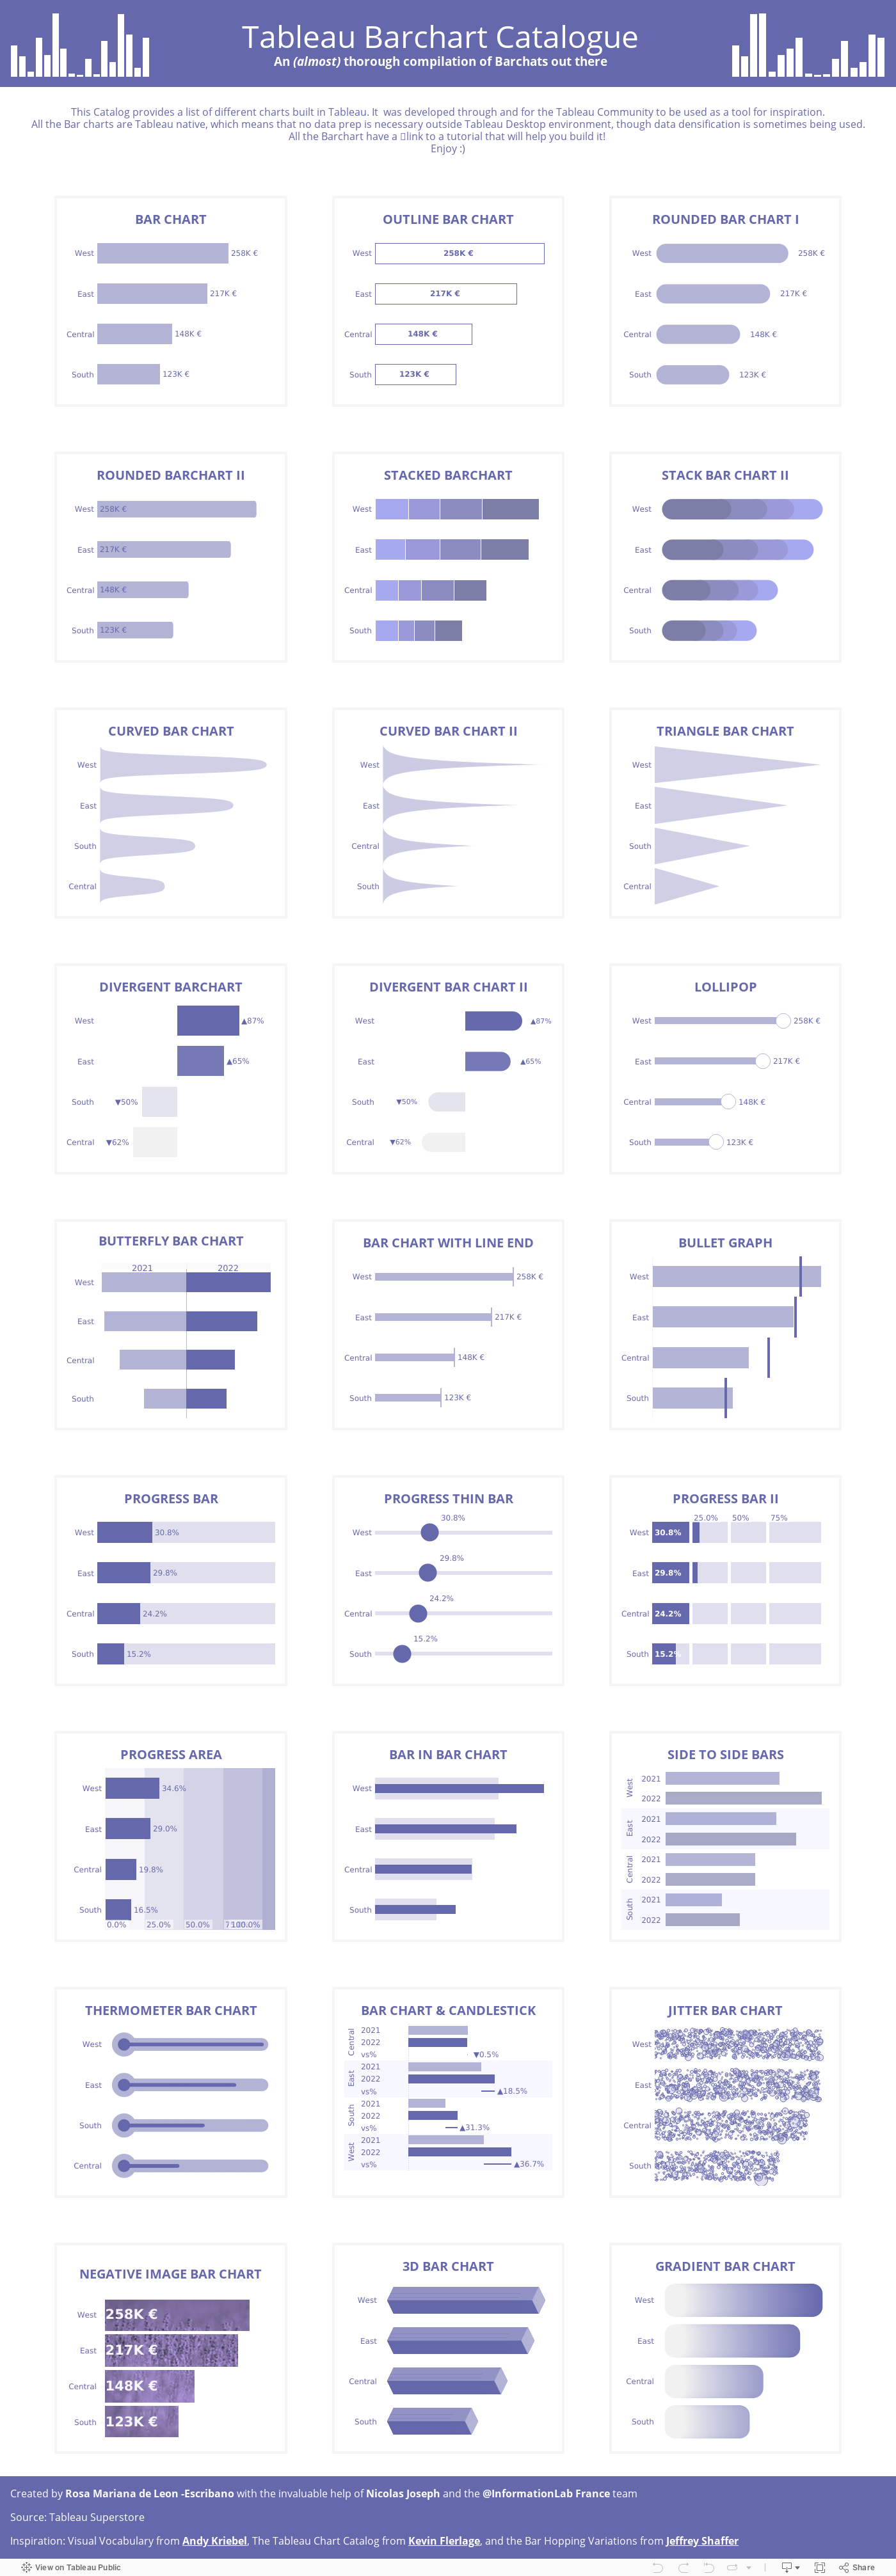
I thought I had wrapped up my miniseries on bar charts when I came across this excellent bar chart catalogue by Rosa Mariana de Leon-E. It includes 27 variations on the bar chart with links to instructions for creating them with Tableau. Enjoy!
Let’s talk about YOUR data!
Got the feeling that you and your colleagues would use your data more effectively if you could see it better? Data Viz for Nonprofits (DVN) can help you get the ball rolling with an interactive data dashboard and beautiful charts, maps, and graphs for your next presentation, report, proposal, or webpage. Through a short-term consultation, we can help you to clarify the questions you want to answer and goals you want to track. DVN then visualizes your data to address those questions and track those goals.