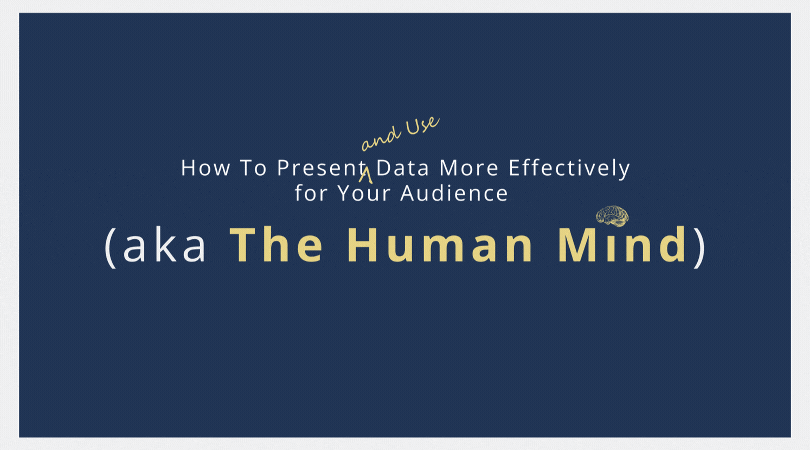
We hear a lot about applying data to action. But for data to make an impact, it must first take a journey through the human mind. Understanding that journey helps us to consume and present data so that the mind can actually see, grasp, remember, and apply it. Here's a preview of the first few slides of my upcoming webinar on this topic: How To Present Data More Effectively For Your Audience (aka The Human Mind).
Want to know what a dog spitting out a pill has to do with data presentations? Then join me on March 17th. Sign up HERE. Use code 'friend10' for $10 off registration.


To see past data tips, click HERE.
Let’s talk about YOUR data!
Got the feeling that you and your colleagues would use your data more effectively if you could see it better? Data Viz for Nonprofits (DVN) can help you get the ball rolling with an interactive data dashboard and beautiful charts, maps, and graphs for your next presentation, report, proposal, or webpage. Through a short-term consultation, we can help you to clarify the questions you want to answer and goals you want to track. DVN then visualizes your data to address those questions and track those goals.


