“Too often, we treat logic models like grant attachments, only to forget them once the funding is secured. But they are living tools—maps that guide strategy, surface gaps, and keep us accountable. Inputs, outputs, outcomes, long-term impact—each part tells a story and prompts a question. When we revisit these regularly, we find clarity and direction.”
- Courtnee Biscardi, Urban League of Broward County, in July 2025 Harvard Business School article
Indeed, logic models (and their close cousins: theories of change) get more play in grant proposals than in the daily work of a project. But what if we could plug a logic model into the real world? What if we could see how our plan is playing out in reality and make adjustments along the way?
You can do just that by creating a type of interactive data dashboard called a “living logic model.” A living logic model compares theory to reality by showing progress to date. It also allows you to track the progress of subgroups and individuals. So it helps you to plan, to ask the right questions, and to make mid-course corrections.
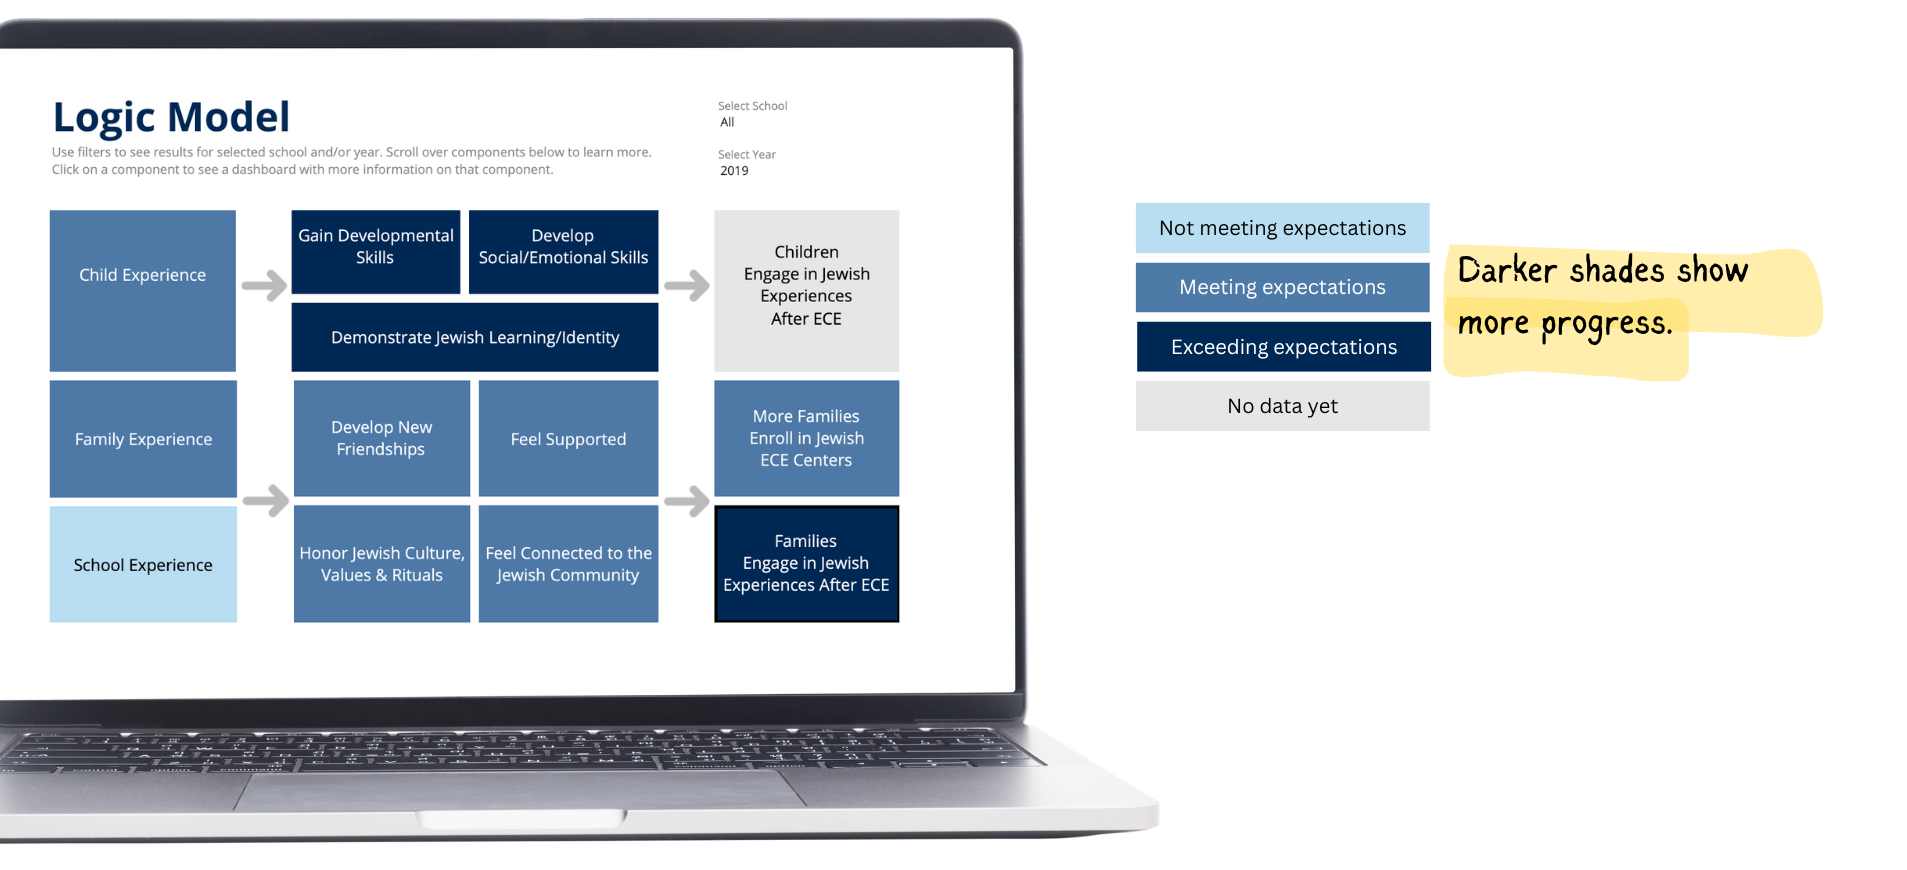
Here's an anonymized version of a living logic model I created for a client. This is a static image but the logic model is interactive. As you can see, darker shades show more progress.
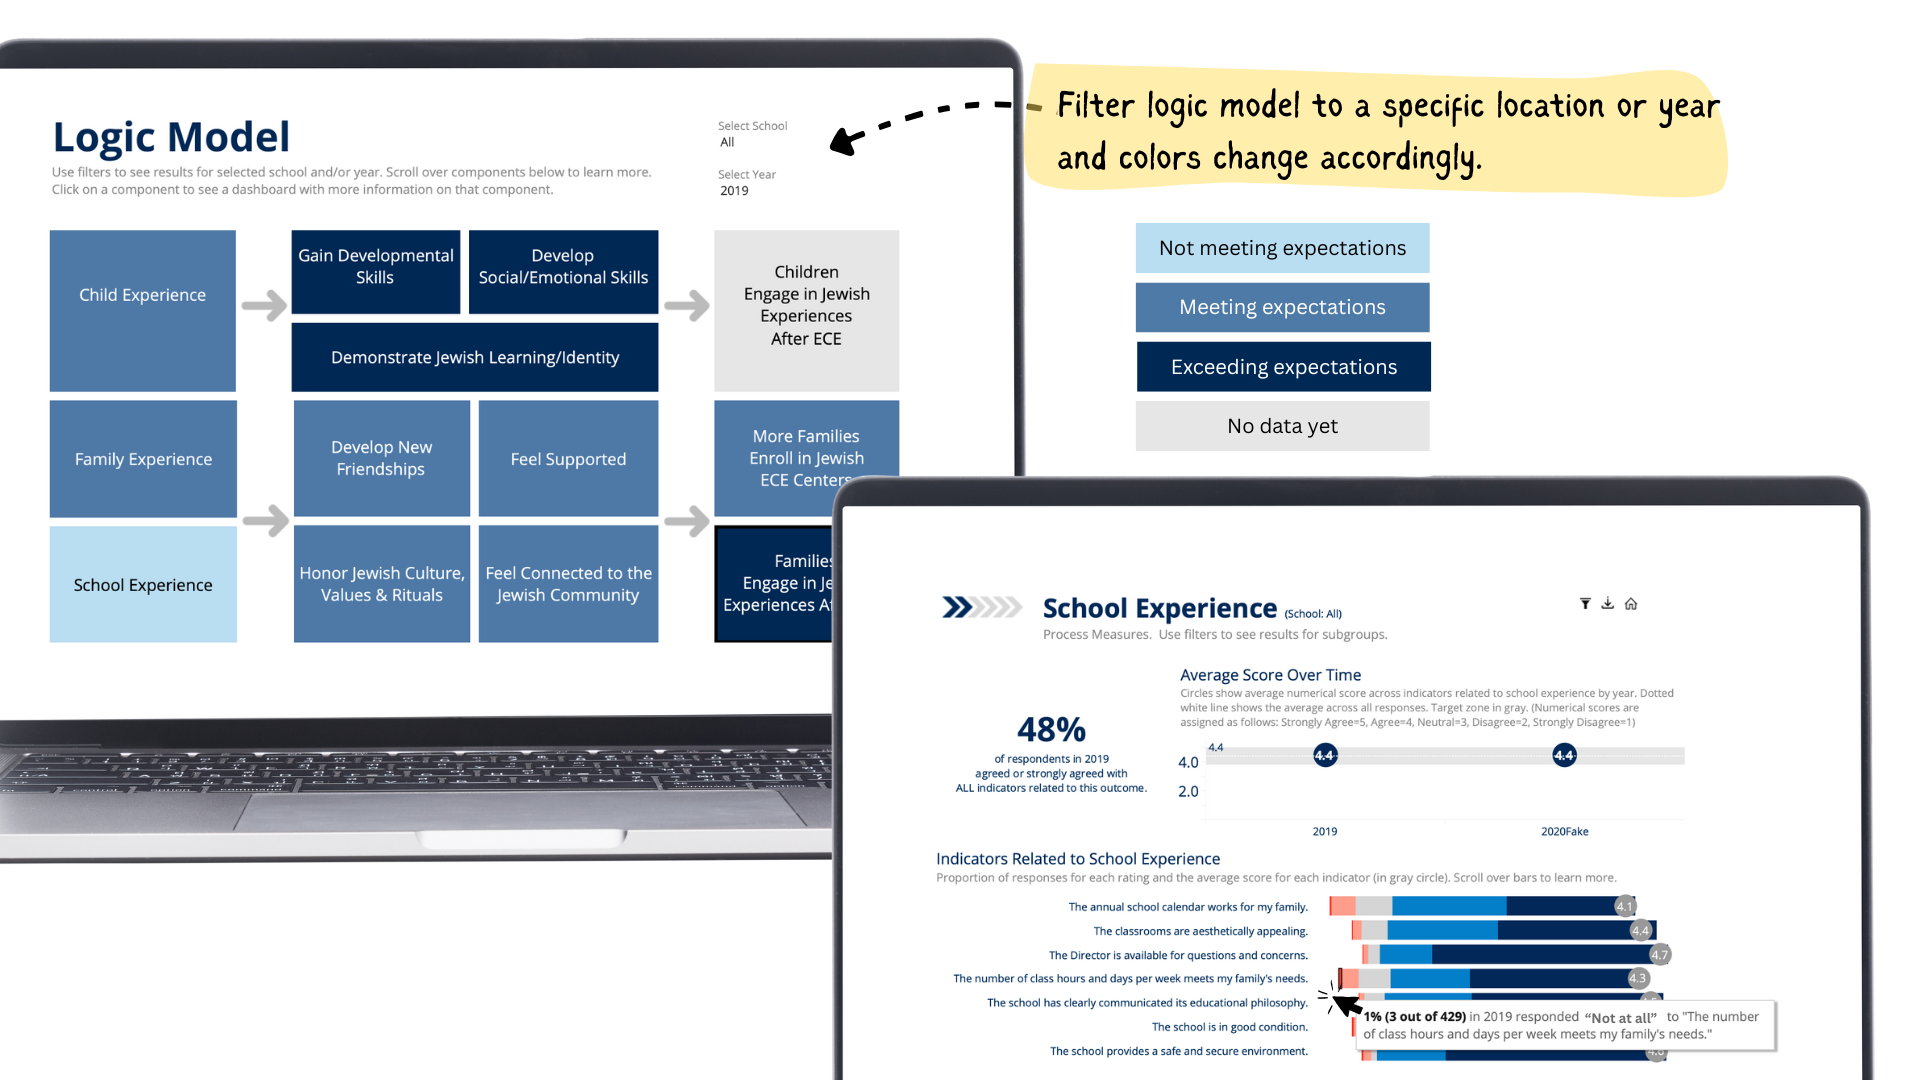
And if you click on any component of the logic model, you are sent to another page that provides much more detail on that component. In this case, we can see how the average score for school experience, based on survey results, has changed over time and results on the various indicators that comprise school experience.
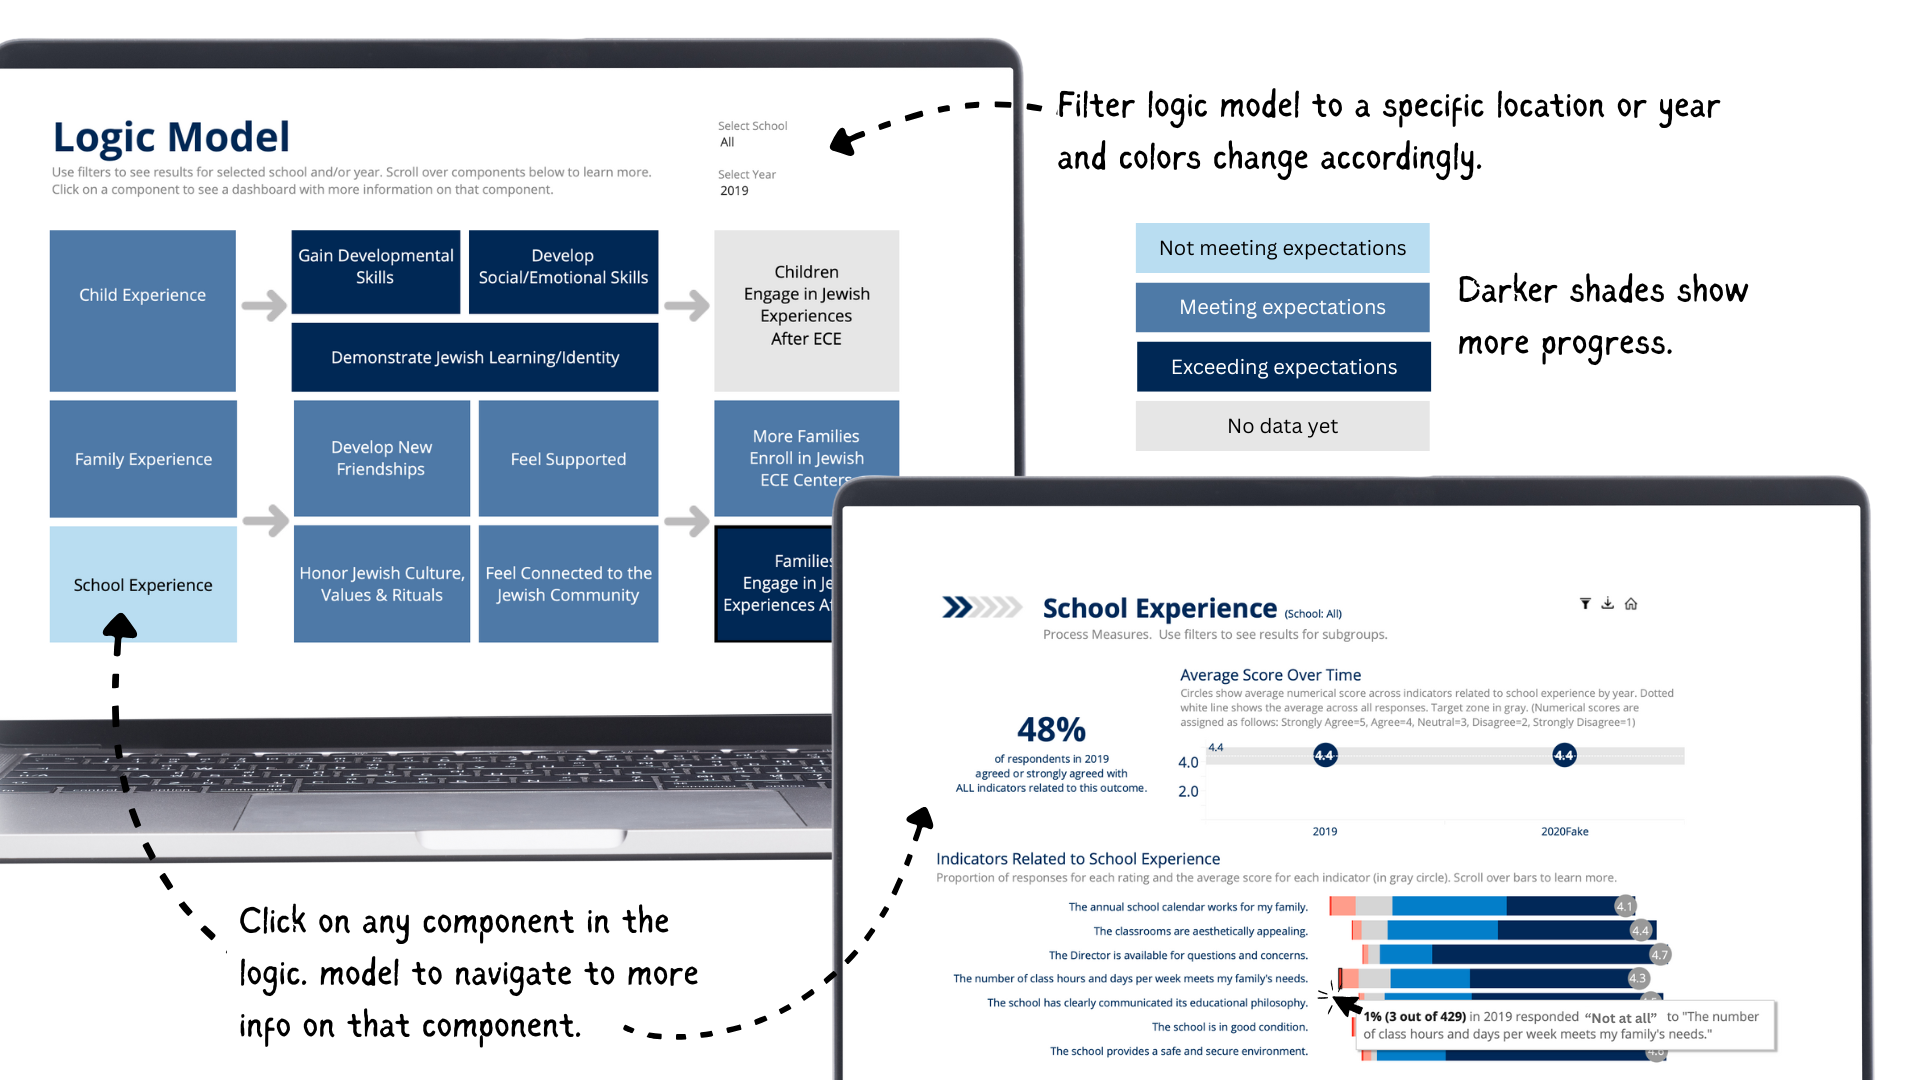
And you can filter the logic model to show results for a specific location (in this case schools) or year.
So living logic models are a great way to track progress over time. Feel free to reach out if you'd like to talk about creating a living logic model for a project or initiative.
Let’s talk about YOUR data!
Got the feeling that you and your colleagues would use your data more effectively if you could see it better? Data Viz for Nonprofits (DVN) can help you get the ball rolling with an interactive data dashboard and beautiful charts, maps, and graphs for your next presentation, report, proposal, or webpage. Through a short-term consultation, we can help you to clarify the questions you want to answer and goals you want to track. DVN then visualizes your data to address those questions and track those goals.