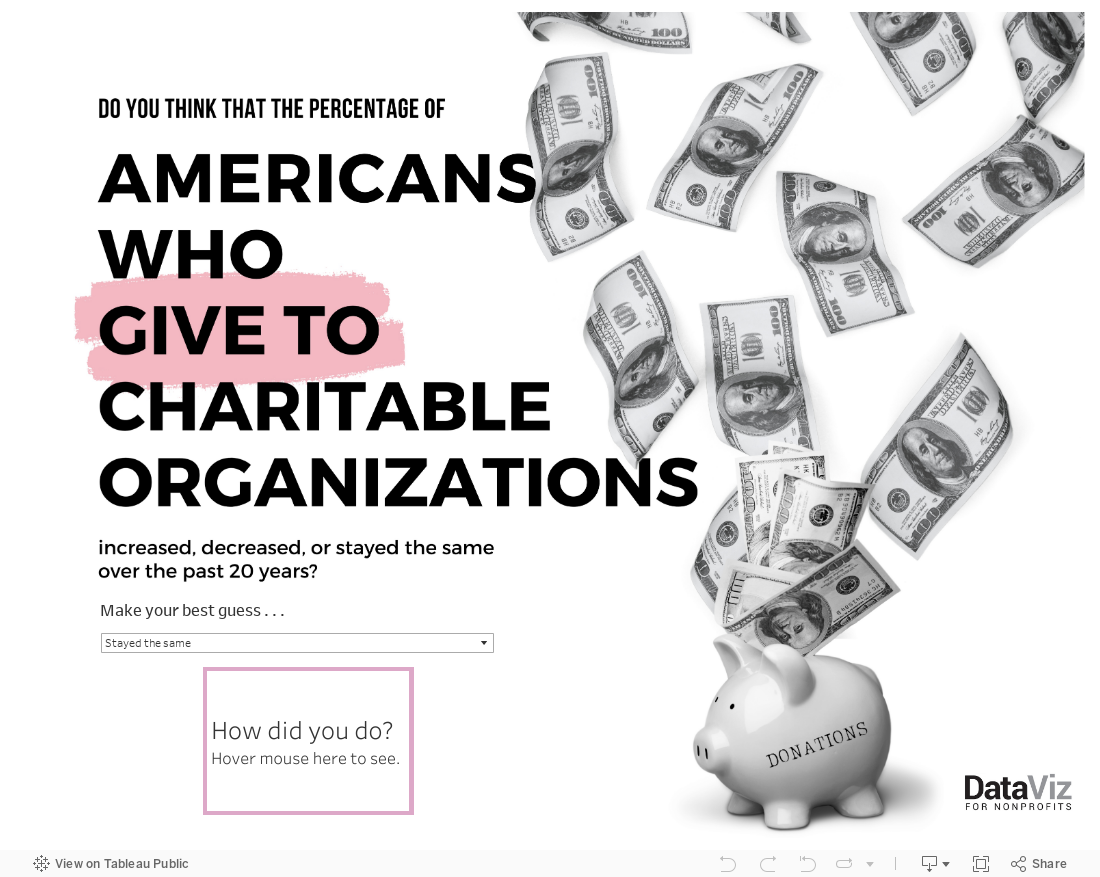
As we move into gifting season, I thought I’d toss out a gift to you. It’s a quick interactive viz that you can employ however you see fit. Use it in a website, presentation, or social media post to rightsize folks’ understanding about the state of charitable giving in the U.S. and, perhaps, help to turn the tide. For the link address or embed code, click on the share icon below.
Let’s talk about YOUR data!
Got the feeling that you and your colleagues would use your data more effectively if you could see it better? Data Viz for Nonprofits (DVN) can help you get the ball rolling with an interactive data dashboard and beautiful charts, maps, and graphs for your next presentation, report, proposal, or webpage. Through a short-term consultation, we can help you to clarify the questions you want to answer and goals you want to track. DVN then visualizes your data to address those questions and track those goals.


