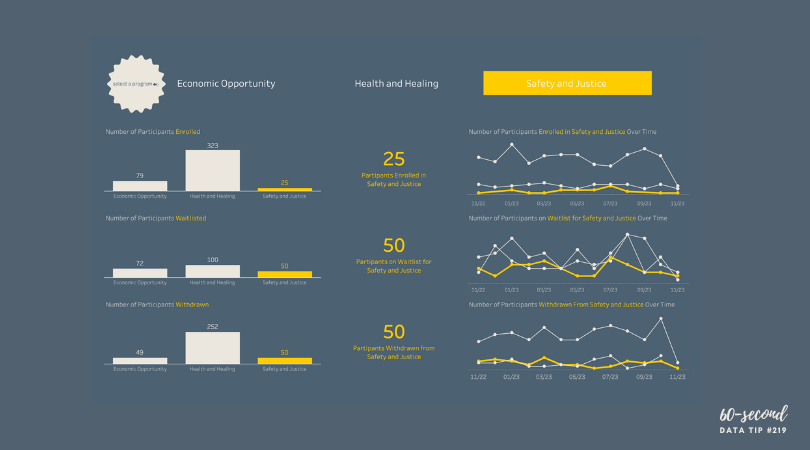
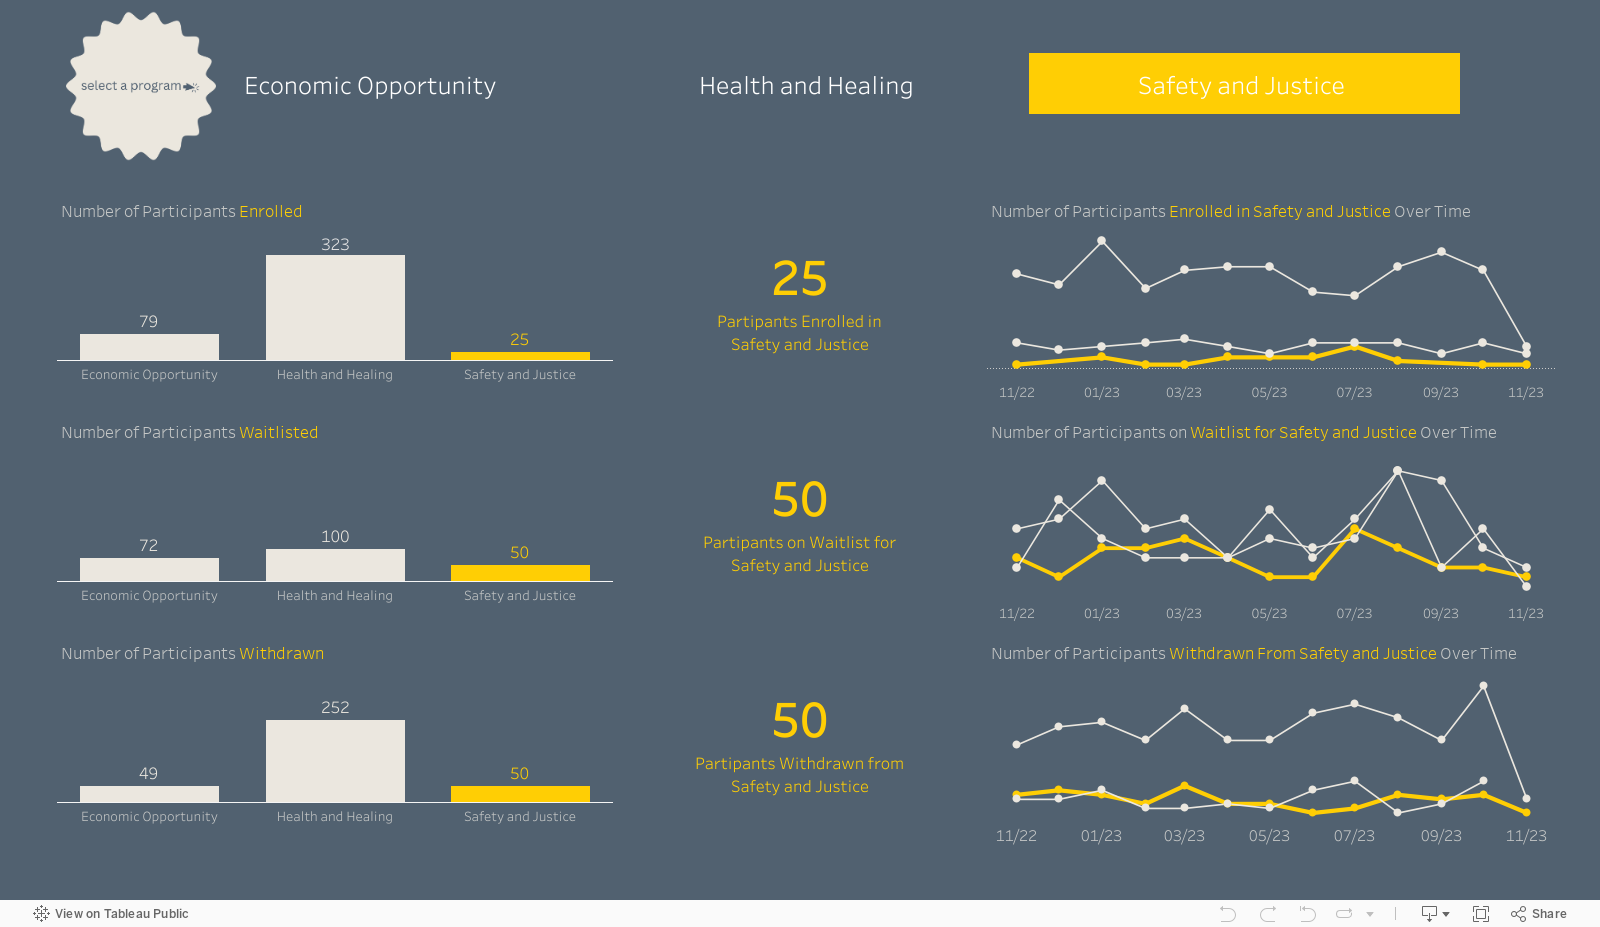
Does your nonprofit have participants (or volunteers or clients or human beings of another sort) in various programs? If so, you could benefit from a dashboard like this one (see below). Give it a spin. Select a program at the top to highlight participants in that program in the charts. This dashboard allows for easy comparisons across programs, across statuses (e.g. enrolled, waitlisted, and withdrawn), and across time. Scroll over charts to learn more.
My inspiration for this dashboard came from Eve Thomas at The Data School. Check out Eve’s article, which includes instructions for creating this type of dashboard with Tableau (assuming basic Tableau knowledge.)
Let’s talk about YOUR data!
Got the feeling that you and your colleagues would use your data more effectively if you could see it better? Data Viz for Nonprofits (DVN) can help you get the ball rolling with an interactive data dashboard and beautiful charts, maps, and graphs for your next presentation, report, proposal, or webpage. Through a short-term consultation, we can help you to clarify the questions you want to answer and goals you want to track. DVN then visualizes your data to address those questions and track those goals.


