
There’s a treasure trove of free data out there. And I know what you are thinking: “I can barely deal with my own data much less anyone else’s!” But think again. What if you could show the need for your services, your potential audiences, or other factors that affect your work without having to collect any data yourself?
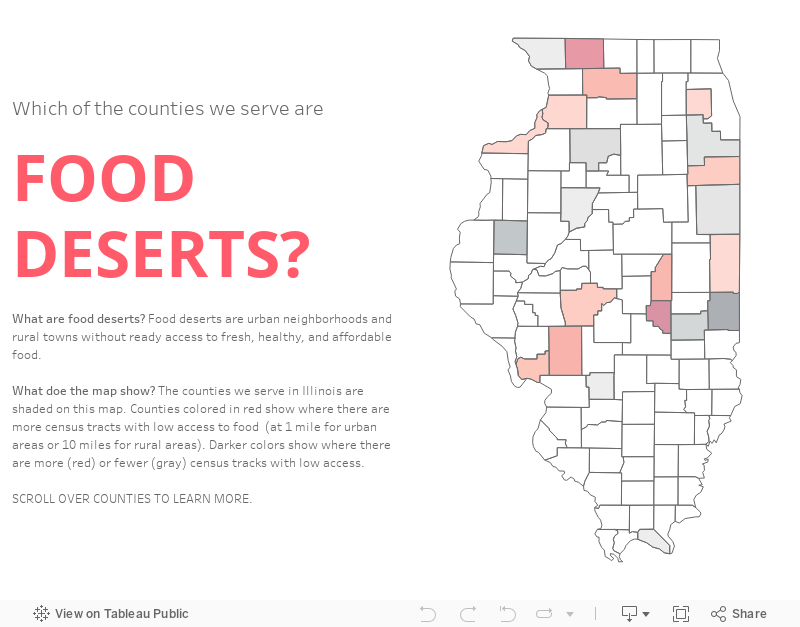
Here’s an example of something you might do. I downloaded free data (in the form of an Excel spreadsheet) from the U.S. Department of Agriculture’s website on food access in 2019. I then combined this data with a list of counties that a (fictional) organization serves in Illinois to create the map below.
You can find any number of websites with lists of free data sources, such as this one. I found the USDA data by following the link from this page to Data.gov which is home to the US government’s open data.* I then clicked on “Data” on the navigation menu and searched for the topic of interest to me.
Fair warning, when searching for free data online, you are likely to find yourself in quite a few rabbit holes. So here are a few tips to make your search more fruitful:
Before you begin searching, know what you are looking for. Consider what geographies, time periods, or populations you need. Also, think about what data format you need. Perhaps you can only deal with Excel or CSV files. When visiting a free data site, determine if any of the data files available for download meet your needs asap. If it’s not clear, then give up and try another site.
If you need local data, check out your city government’s website. Many have open data available for download.*
Look for a data dictionary or some other type of documentation to understand what is included in the data, how the data was collected, and what each data field means. Sometimes this is included on a tab in the downloaded data file. Pay attention to what might be missing from the data and the biases that could be baked into it.
Link back to data sources (or attribute with text) when showing the data in charts, maps, and graphs.
Combine free data with your own data using zip codes, city names, census tracts or other data fields to link the two data sources.
* Open data is data that can be freely used, re-used, and redistributed by anyone, subject only, at most, to the requirement to attribute and share-alike.
Let’s talk about YOUR data!
Got the feeling that you and your colleagues would use your data more effectively if you could see it better? Data Viz for Nonprofits (DVN) can help you get the ball rolling with an interactive data dashboard and beautiful charts, maps, and graphs for your next presentation, report, proposal, or webpage. Through a short-term consultation, we can help you to clarify the questions you want to answer and goals you want to track. DVN then visualizes your data to address those questions and track those goals.


