How To Recognize and Reform Vanity Metrics

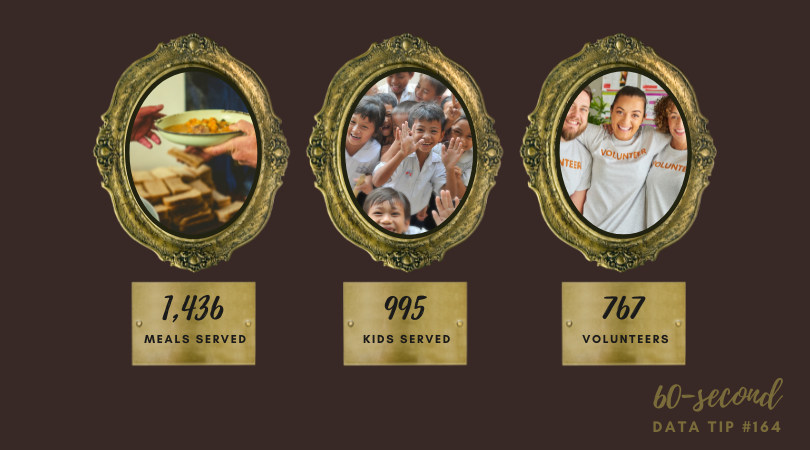
Vanity metrics are like cheap, trendy sunglasses. They may help you to look cool, briefly, but they don’t last long and do little to improve your eyesight. You’ve seen vanity metrics, even if you haven’t used this term to describe them. They are those flashy statistics (sometimes called “big ass numbers”) and charts showing how many services an organization has provided or people they’ve served or some other seemingly impressive stat. The problem is that these metrics don’t help you to better understand your current work and improve it. In this tip, I’ll give you some quick advice on recognizing and reforming vanity metrics.

How To Recognize A Vanity Metric

This Tableau article suggests three questions to ask to identify a vanity metric. I’ve put a nonprofit spin on each:

  • What decision can we make with the metric? If the metric can’t help you to make a decision, it’s probably a vanity metric. For example, does knowing how many meals you delivered help you to decide who, what, where, when, or how to deliver meals in the future? Or do you need a more specific metric such as the gap between need and service provision for various subgroups of clients?

  • What can we do to intentionally reproduce the result? Did some random event produce the big number? For example, did you see a bump in the number of participants last year because another organization, providing a similar service, closed down? If you cannot consistently reproduce the same result next year, this isn’t a helpful metric.

  • Is the data a real reflection of the truth? Let’s face it. There are always ways to misrepresent the truth. You can tell the world that attendance at all of your programs last year totaled 3,237. Sounds good, but that’s probably a “duplicated number” and can be misleading depending on what you want to understand or broadcast to the world. Some people likely attended more than one program. So the total number of individuals who participated in any program could be much lower. The central question to ask yourself when considering a metric is whether or not it will help your organization achieve its goals. If your goal is to reach more folks, this metric is not helpful.

How To Reform A Vanity Metric

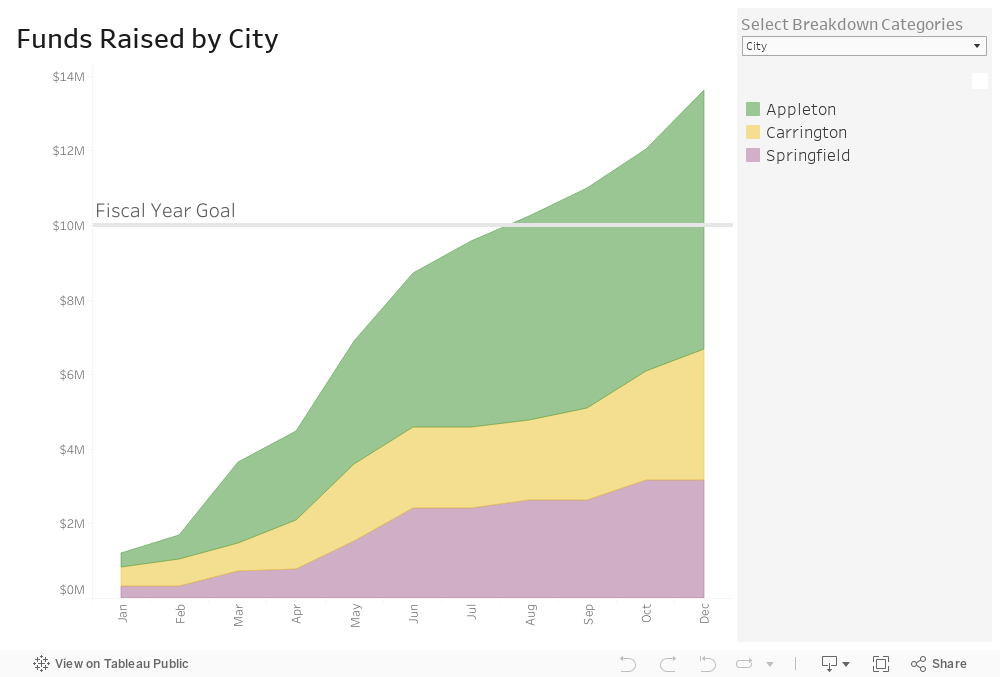
  • Provide context. The metrics that are worthy of your attention and your stakeholders’ attention are those that are directly related to your goals. You may have overall goals for all of your participants, clients, audiences, services, programs, etc. But you also might have specific goals for subsets of those groups and for specific time periods. Present your metrics in relation to the goals. And compare metrics for subgroups to each other to see where you are making progress and where you are not.

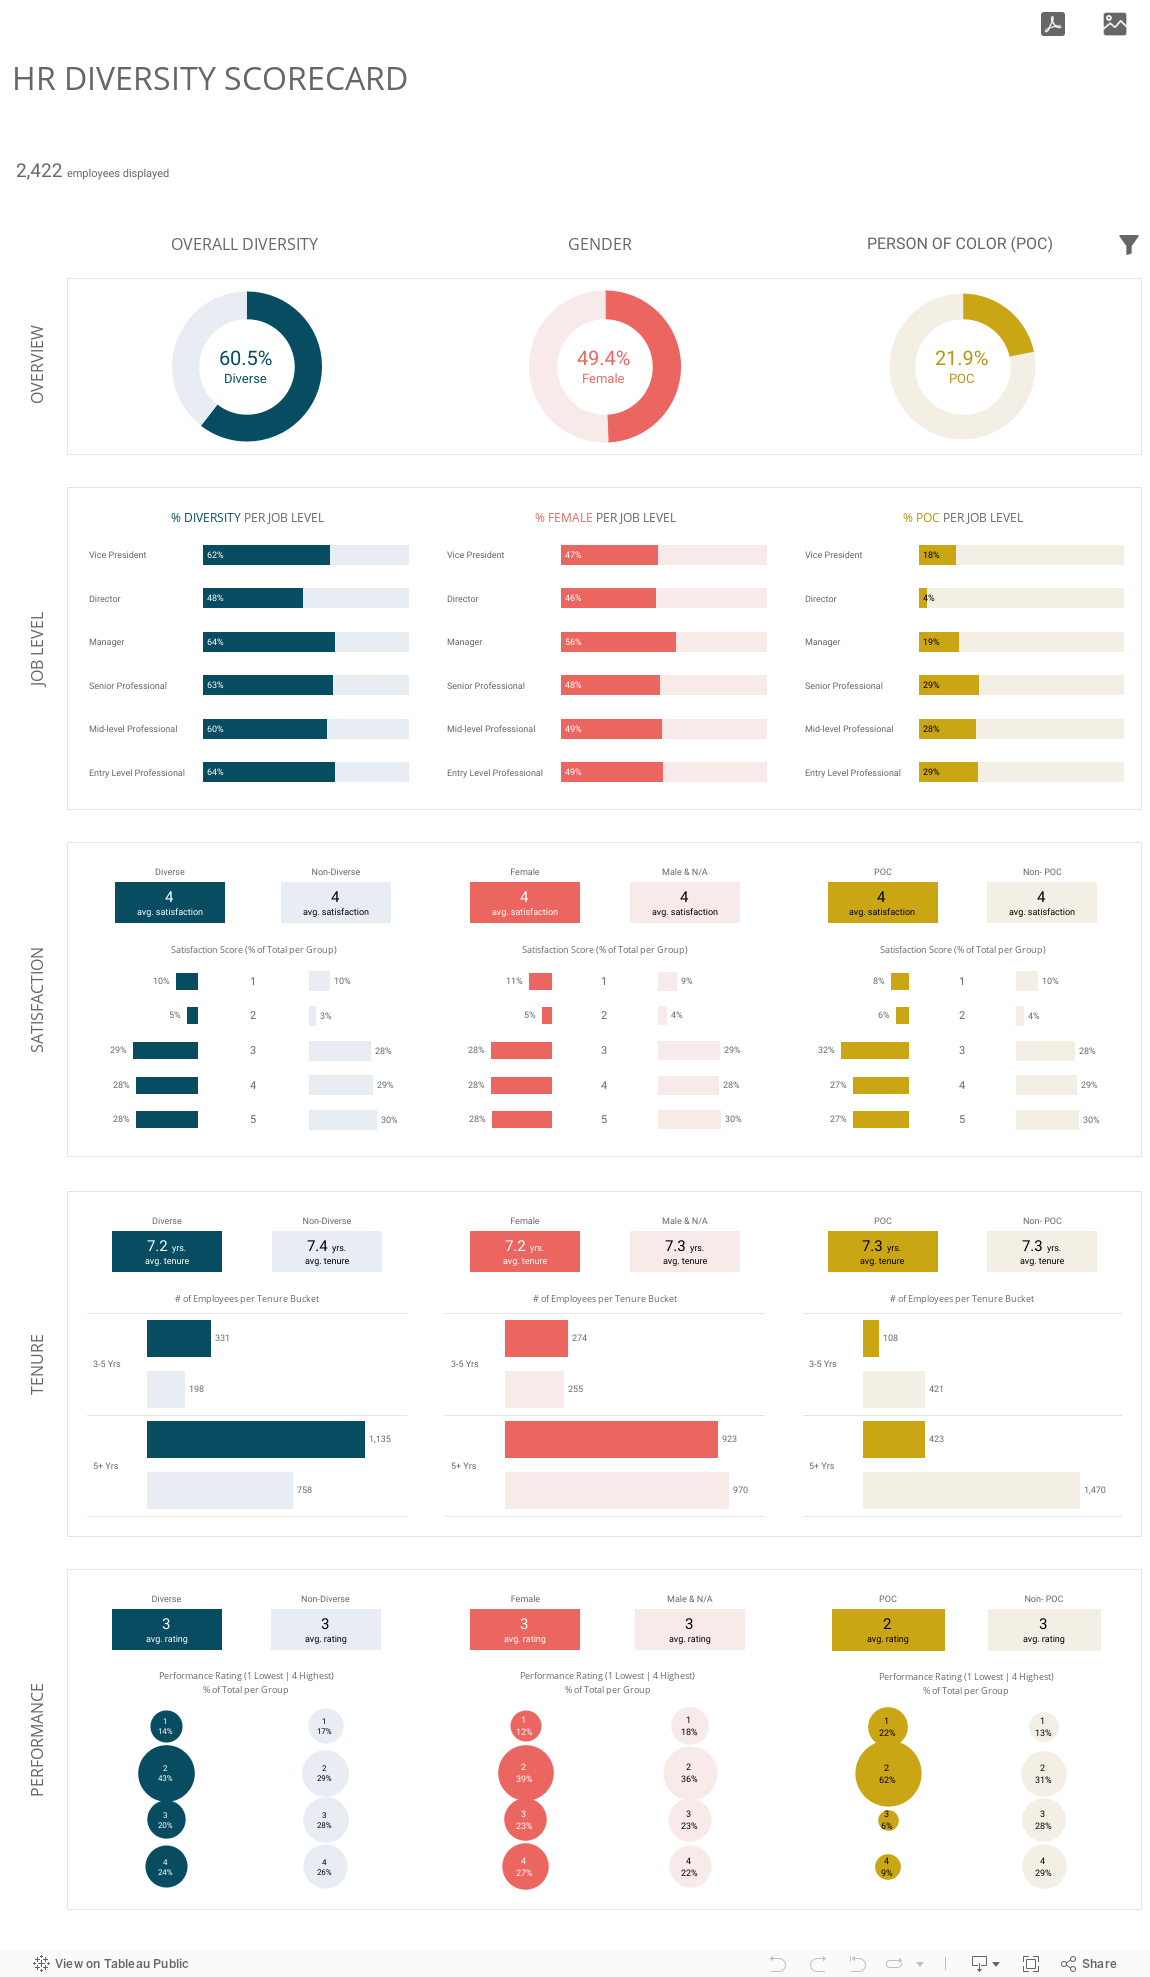
  • Use more than one statistic. Sometimes what you want to improve cannot be measured with just one metric. For example, if you aim to improve the diversity of your staff, you may want to look at a set of metrics together including number, tenure, and seniority of staff by race/ethnicity, gender identification, age, etc.

Sources: Moving Beyond Vanity Metrics, Stanford Social Innovation Review and Vanity Metrics: Definition, How To Identify Them, And Examples, Tableau.


Let’s talk about YOUR data!

Got the feeling that you and your colleagues would use your data more effectively if you could see it better? Data Viz for Nonprofits (DVN) can help you get the ball rolling with an interactive data dashboard and beautiful charts, maps, and graphs for your next presentation, report, proposal, or webpage. Through a short-term consultation, we can help you to clarify the questions you want to answer and goals you want to track. DVN then visualizes your data to address those questions and track those goals.


How To Make Big Numbers Tangible

We’ve talked about the problem with big numbers before. Most recently, we considered the difficulty humans have digesting large numbers and how “perspectives” — simple sentences that relate a large number to something more familiar to us — can help us to understand, assess, and recall numbers. (For more on this, check out the data tip.)

I’m returning to the big number problem today and offering up some new tips for dealing with them. The inspiration for these tips came from the data-driven documentaries of Neil Halloran, specifically his first documentary called The Fallen of World War II. If you have a few more minutes to spare after reading this 60-second tip (and are not among the 13 million + who have viewed it already), I highly recommend that you check it out. It’s 18 minutes long, but the techniques listed below all appear in the first 7 minutes.

Halloran uses the following techniques to make larger numbers understandable. And you don’t need to be a filmmaker to use them. You can apply them to simple data presentations on websites, reports, and PowerPoints.

  1. Use shapes or icons (rather than bars) to represent one or more people, programs, etc. Halloran uses a human figure shape to represent 1,000 people.

  2. Show an aggregate and then break it down by subgroups and time periods. Halloran shows aggregates, such as the total number of U.S. soldiers who died and then, using animation, redistributes the human figures to show how many soldiers died in the European and Pacific theaters and then how many died over time. The animation is cool but not necessary. You can do the same thing with a series of static images. See example below.

  3. Juxtapose photos and charts. To keep the discussion from becoming too abstract, Halloran reminds the audience what actual soldiers (rather than icons) look like by incorporating photos into his presentation. Again, animation is not necessary. Static photos can be placed along side charts.

  4. Walk audience through the data. To give the audience a sense of scale, the video progresses from smaller to larger numbers. Halloran first walks us through casualty stats for the U.S. and European countries. These numbers seem quite high so by the time Russian stats are shown, we are blown away.


Let’s talk about YOUR data!

Got the feeling that you and your colleagues would use your data more effectively if you could see it better? Data Viz for Nonprofits (DVN) can help you get the ball rolling with an interactive data dashboard and beautiful charts, maps, and graphs for your next presentation, report, proposal, or webpage. Through a short-term consultation, we can help you to clarify the questions you want to answer and goals you want to track. DVN then visualizes your data to address those questions and track those goals.


How To Improve Your Organization’s Time Line

Here’s a simple data viz idea. Next time you make a time line showing your organization’s milestones, size those milestone markers (usually circles) according to some key measure. Voila! You are not only showing what happened but also your progress along the way.

The data for such a viz is super simple. Something like this:

Screen Shot 2021-08-24 at 9.01.48 AM.png

I connected the data shown above to Tableau Public (the free version of Tableau) to create the time line below. Vertical time lines not only suggest an upward progression but also work better on phone screens.

Dashboard 1 (3) (1).png

Let’s talk about YOUR data!

Got the feeling that you and your colleagues would use your data more effectively if you could see it better? Data Viz for Nonprofits (DVN) can help you get the ball rolling with an interactive data dashboard and beautiful charts, maps, and graphs for your next presentation, report, proposal, or webpage. Through a short-term consultation, we can help you to clarify the questions you want to answer and goals you want to track. DVN then visualizes your data to address those questions and track those goals.


How To Make Data Dashboards More Comfortable

I’m always looking for ways to make data more comfortable, particularly for non-data people. Sometimes that means creating simple charts that everyone can understand. Sometimes that means limiting the number of charts presented. And today, I offer up another tip: show your data in a familiar environment. For many of us, paper, file folders, paper clips, and post-it notes are familiar and, dare I say, even comforting.

Give this old-school-meets-new-school data dashboard a spin and see what you think. It shows real-time data in an interactive format. And if you’d like some help creating a similar dashboard for your organization, feel free to contact me.


Let’s talk about YOUR data!

Got the feeling that you and your colleagues would use your data more effectively if you could see it better? Data Viz for Nonprofits (DVN) can help you get the ball rolling with an interactive data dashboard and beautiful charts, maps, and graphs for your next presentation, report, proposal, or webpage. Through a short-term consultation, we can help you to clarify the questions you want to answer and goals you want to track. DVN then visualizes your data to address those questions and track those goals.


How To Create More Diverse, Equitable, and Inclusive Data Visualizations

When we visualize information, we make a series of decisions which affect the way that viewers process the information in our charts, maps, and graphs. Sometimes they don’t feel like decisions at all. We go with the default settings in the application we are using. Or we just do something the way it’s usually done. But a more diverse, equitable, and inclusive approach to presenting and visualizing data requires us to make those decisions more consciously and deliberately. Jonathan Schwabish and Alice Feng of the Urban Institute provide some helpful tips, based on the Urban Institute’s own style guide, which you can apply the next time you present data.

Here is a summarized version of Schwabish and Feng’s article.* And here is my 60-second version of their recommendations:

  • Use people-first language in titles, text, and labels associated with charts, maps, and graphs. For example, use “people with disabilities” rather than “disabled people.” Also Urban does not refer strictly to skin color. For example, they refer to “Black people” not “Blacks.”

  • Order and present groups purposefully. The first group shown in a table or the first bar in a graph can affect how readers perceive the relationship or hierarchy among groups. For example, if the first group is “Men,” then it may appear that men are the default group against which other groups should be compared. One way to prevent viewers from making certain comparisons is to display groups in side-by-side charts (aka “small multiples” charts) rather than on a single chart. In general, make ordering and grouping decisions to promote certain comparisons and prevent others.

  • Point to missing groups. If certain groups are missing from the data, explain why in text boxes or footnotes. Also add information on groups included in “Other” categories and consider providing a more specific label than “Other” which can have an exclusionary connotation.

  • Do not use color palettes that reinforce gender or racial stereotypes. This one may seem obvious, but it bears repeating. Also, Urban’s color palette is accessible to people with certain color vision deficiencies, and the contrast between those colors and white and black text meet basic accessibility guidelines.

  • Depict a variety of races and genders when using icons and avoid icons that make inappropriate depictions of people or communities or reinforce stereotypes such as showing traditionally feminine icons to depict nurses or traditionally masculine icons to depict bosses.

  • Find ways to show the people behind the data. Data visualizations are, by definition, abstractions of larger realities. But in the process of abstracting, we may obscure the lived experiences of the real people whom the data represent. Visualizations can remind viewers about the individuals behind the data by, for example, depicting them as individual circles rather than aggregating them in a single bar.

* The full paper has been published as an OSF Preprint and can be accessed here.


Let’s talk about YOUR data!

Got the feeling that you and your colleagues would use your data more effectively if you could see it better? Data Viz for Nonprofits (DVN) can help you get the ball rolling with an interactive data dashboard and beautiful charts, maps, and graphs for your next presentation, report, proposal, or webpage. Through a short-term consultation, we can help you to clarify the questions you want to answer and goals you want to track. DVN then visualizes your data to address those questions and track those goals.


How To Present Diversity Data (or What To Steal From This Diversity Scorecard)

Today’s tip is to take inspiration from Chantilly Jaggernauth’s excellent diversity scoreboard displayed below. It shows diversity among employees in a company but can easily be applied to staff or participants in a nonprofit organization.

I suggest you steal the following ideas from Chantilly:

  • Metric Definitions. In a Tableau Conference session, Chantilly shares the pros and cons of the four metrics in the dashboard. See image of the slide below. None of the metrics are perfect. But together they provide an understanding of where an organization is in its diversity efforts. These definitions are not incorporated in the dashboard itself but could be added through a link or in a tooltip (scroll over) feature.*

  • Views of Diversity. The dashboard provides three views of diversity: overall, gender, and people of color (POC). By providing side-by-side charts with these three views, the dashboard allows users to see variations that overall diversity charts obscure.

  • Color Coding. Each type of diversity has its own color, which makes the comparison among overall, gender, and POC easy, even when you scroll down and can no longer see the column headers. Also the comparison groups (non-diversity, male, and non-POC) are represented by the same colors in lighter shades. This approach makes the dashboard easier to understand. Assigning three additional colors for the comparison groups could be confusing and require a color legend.

  • Simple Charts. These are all charts we all know how to read. So the scorecard is accessible immediately to anyone, even if they are not familiar with the data or the organization.

  • Also, note that the dashboard and the slide use different terms for two of the metrics.

Source: HR Diversity Scorecard on Tableau Public by Lovelytics

Image above from Tableau Conference session called “Next Gen Analytics for Your New Normal” on 11/10/21.


Let’s talk about YOUR data!

Got the feeling that you and your colleagues would use your data more effectively if you could see it better? Data Viz for Nonprofits (DVN) can help you get the ball rolling with an interactive data dashboard and beautiful charts, maps, and graphs for your next presentation, report, proposal, or webpage. Through a short-term consultation, we can help you to clarify the questions you want to answer and goals you want to track. DVN then visualizes your data to address those questions and track those goals.


Interesting Versus Actionable Data

60-SECOND DATA TIP_4 (3).gif

It’s easy to get lost in a sea of interesting data when what you really need is actionable data. As Oracle’s Nate Mayfield points out, you know when you’ve presented only interesting data when you get this type of response: “Oh, cool. Yeah, that's great to know.” On the other hand, if you hear “Oh, okay. I can definitely decide what to do now,” then you’ve presented actionable data.

The key to presenting actionable data is to ask specific—rather than broad—questions. And then design your charts, maps, and graphs to answer those narrower questions. Mayfield’s article focuses on the types of questions a business might ask. Let’s consider the types of questions a nonprofit might ask:

Interesting Questions.png

Mayfield notes that data dashboards that are designed for a wide range of users tend to address only interesting questions. “Because they are intended for a broad set of users, with a lot of filters, you can in theory answer a lot of questions with these sprawling dashboards,” says Mayfield. “The problem is people quickly get lost in them and don’t spend the time required to answer their questions.” Instead, Mayfield advises us to create simple dashboards that answer quite specific questions such as the actionable questions above. So consider a series of simple dashboards, each designed to provide answers that prompt action for a particular type of user.

To see past data tips, including tips on other types of pantry staple data, click HERE.


Let’s talk about YOUR data!

Got the feeling that you and your colleagues would use your data more effectively if you could see it better? Data Viz for Nonprofits (DVN) can help you get the ball rolling with an interactive data dashboard and beautiful charts, maps, and graphs for your next presentation, report, proposal, or webpage. Through a short-term consultation, we can help you to clarify the questions you want to answer and goals you want to track. DVN then visualizes your data to address those questions and track those goals.


How To Showcase Your Sites With An Interactive Map

60-SECOND DATA TIP_3 (4).png

Here’s a viz you can use. It is interactive, can be built in Tableau Public for free, and can be embedded in your website. This example shows affordable housing sites. Give it a try below and check out these features:

  • The circles on the map show the location of the sites. The color of the circles show the type of site, and the size of the circles indicates number of units (but you can size your circles by any measure such as number of people served or programs offered.)

  • Click on a site on the map to see more information, to the right, about the site including a photo.

  • When you click on a site, it is also highlighted on the chart below so you can compare that site to the others.

To learn how to create an interactive map with similar features in Tableau Public, check out this tutorial. I’d also be happy to build one for you, customized to your needs. Just click “Schedule A Free Consultation” below.

Let’s talk about YOUR data!

Got the feeling that you and your colleagues would use your data more effectively if you could see it better? Data Viz for Nonprofits (DVN) can help you get the ball rolling with an interactive data dashboard and beautiful charts, maps, and graphs for your next presentation, report, proposal, or webpage. Through a short-term consultation, we can help you to clarify the questions you want to answer and goals you want to track. DVN then visualizes your data to address those questions and track those goals.


How to Show Your Progress With Color Alone

60-SECOND DATA TIP_3.png

"Color is a power which directly influences the soul." -Wassily Kandinsky

It’s August, so it seems appropriate to talk about heat maps. I’ve blogged about this simple yet powerful chart type before. It takes advantage of the power of color like no other chart I know. Heat maps use variations in color to show differences among categories (e.g. people living in different zip codes) or differences across a scale (e.g. people with different income levels). In a lot of cases, it’s simply a table with color added to the cells.

The enormous potential of a heat map is clear in Philip Bump’s recent heat map in The Washington Post, which took its inspiration from Thomas Wood’s similar chart. As Bump notes, this chart is “elegantly simple.” The rows are states, grouped by region. The columns are presidential election years. And shades of red and blue indicate the parties of candidates who won in each state, with darker shades indicating wider margins. Here’s part of the chart:

Source: The Washington Post, August 24, 2021

Source: The Washington Post, August 24, 2021

By carefully grouping the states into regions and subregions, the chart reveals interesting patterns: shifts from blue to red (and vice versa) as well as shifts from greater to lesser margins (and vice versa).

Think about how you can show change over time in the problems you are addressing or the services you are offering using color and strategic groupings. Here are some possible applications for organizations like yours:

  • Show shifts in service use over time among two (or more) groups such as adults represented by one color and children represented by another. Each row might be a zip code area and rows could be grouped by city.

  • Show changes in pollution over time produced by two (or more) sources such as vehicles represented by one color and factories by another. Each row might be a country and rows could be grouped by continent.

  • Show variation in client make up over time among two (or more) groups such as higher income groups represented by one color and lower income groups by another. Each row might be a program site and rows could be grouped by neighborhood.

You can create heat maps in many data viz programs. Here is how to create them in Excel and in Tableau.


Let’s talk about YOUR data!

Got the feeling that you and your colleagues would use your data more effectively if you could see it better? Data Viz for Nonprofits (DVN) can help you get the ball rolling with an interactive data dashboard and beautiful charts, maps, and graphs for your next presentation, report, proposal, or webpage. Through a short-term consultation, we can help you to clarify the questions you want to answer and goals you want to track. DVN then visualizes your data to address those questions and track those goals.


Ideas You Should Steal From This Viz (Installment 2)

60-SECOND DATA TIP_3.png

“Every artist gets asked the question: ‘Where do you get your ideas?’ The honest artist answers, ‘I steal them.’ . . . What a good artist understands is that nothing comes from nowhere. All creative work builds on what came before.” —Austin Kleon in Steal Like An Artist.

Recently, I recommended that you steal ideas from this data viz . Today I offer up another steal-worthy interactive viz that I came across in the Tableau Public Gallery.

Source: Ellen Blackburn on Tableau Public

Here’s what I suggest you steal from this viz:

  • Vertical Timeline. The vertical timeline looks cool and works better than a horizontal one on a phone screen.

  • Self-Explanatory Chart. Each action by the Trump Administration is represented by a square. I would have stated this in the subtitle, but I think the chart is pretty self-explanatory once you begin interacting with it (give it a try). It’s easy to see when there were more or fewer actions and what proportion of actions are considered anti-LGBTQ+ and anti-trans.

  • Detail on Demand. When you scroll over the squares, you get a lot more detail on the particular actions. But none of this detail is visible until you start scrolling. So the details do not obscure the overall patterns and change over time.

  • Controlled color palette. Using just two colors for the squares and one color for the text lets the patterns shine through. Also, the off-white background looks like a piece of paper, making the viz seem more approachable.

To see past data tips, click HERE.


Let’s talk about YOUR data!

Got the feeling that you and your colleagues would use your data more effectively if you could see it better? Data Viz for Nonprofits (DVN) can help you get the ball rolling with an interactive data dashboard and beautiful charts, maps, and graphs for your next presentation, report, proposal, or webpage. Through a short-term consultation, we can help you to clarify the questions you want to answer and goals you want to track. DVN then visualizes your data to address those questions and track those goals.


Ideas You Should Steal From This Viz (Installment 1)

60-SECOND DATA TIP_3.png

“Every artist gets asked the question: ‘Where do you get your ideas?’ The honest artist answers, ‘I steal them.’ . . . What a good artist understands is that nothing comes from nowhere. All creative work builds on what came before.” —Austin Kleon in Steal Like An Artist.

Today’s tip is to steal ideas from other data visualizations. Here’s a viz I recently came across in the Tableau Public Gallery:

Source: Jacqui Moore on Tableau Public

Source: Jacqui Moore on Tableau Public

I’ve stacked the four squares below so that you can see it close up. And here’s what I suggest you steal from this viz:

  • Simple charts. The viz has only two types of charts: bar charts and line graphs. And they are so simple to read. Distracting elements (like axes and gridlines) are eliminated so that you can easily compare the world to North America, both now and over time.

  • Repetition of charts. The same charts are repeated for each of four categories, making comparison among categories quite easy.

  • Images. The simple images relating to mountains, terrestrial, freshwater, and marine help us to distinguish among the four categories and add visual appeal.

  • Controlled color palette. The viz focuses attention on the four categories by diverging from the monochromatic color scheme only in the images.

Untitled design (1).png

I look forward to sharing other steal-worthy data visualizations with you in future data tips! To see past data tips, click HERE.


Let’s talk about YOUR data!

Got the feeling that you and your colleagues would use your data more effectively if you could see it better? Data Viz for Nonprofits (DVN) can help you get the ball rolling with an interactive data dashboard and beautiful charts, maps, and graphs for your next presentation, report, proposal, or webpage. Through a short-term consultation, we can help you to clarify the questions you want to answer and goals you want to track. DVN then visualizes your data to address those questions and track those goals.


Understand Social Media Impact Using "Pantry Staple" Data

60-SECOND DATA TIP_3.gif

Social media data is another staple in our data pantries. Your organization probably has it. But you might not make good use of it. Why? Well, social media analytics come in many flavors and can bewilder. Posts are like bait. The better the bait, the more nibbles and bites leading to website traffic and eventually to more donations, volunteers, participation, and other types of engagement. But we need a way to easily decipher which types of bait are working best. And drawing this information out of the data can be a challenge.

Need some inspiration? Check out Alice McKnight’s dashboard below. It provides a broad array of social media data in an appealing and accessible format. We can see how effective social media posts are at various times. The charts along the top give us the basic trends over the last several months. It also shows us what topics are drawing attention. Give it a try. Check out the “View By” options which filter the two charts at the bottom. Then consider how you might visualize your own social media data using similar charts.

Source: Alice McKnight on Tableau Public

To see past data tips, including tips on other types of pantry staple data, click HERE.


Let’s talk about YOUR data!

Got the feeling that you and your colleagues would use your data more effectively if you could see it better? Data Viz for Nonprofits (DVN) can help you get the ball rolling with an interactive data dashboard and beautiful charts, maps, and graphs for your next presentation, report, proposal, or webpage. Through a short-term consultation, we can help you to clarify the questions you want to answer and goals you want to track. DVN then visualizes your data to address those questions and track those goals.


Understand Your Budget Using "Pantry Staple" Data

60-SECOND DATA TIP_3.png

Budget data is another staple in our data pantries. We need our staff, board members, funders, clients, and other stakeholders to understand this data. But many of them are not comfortable with financial spreadsheets. Here are some ways to present budget data that allow others to gain quick insight and, perhaps, dig deeper. These examples all come from the public sector but are easily applied to a nonprofit organization’s budget.

2016 U.S. Budget

The Obama administration made the Byzantine federal budget accessible to the world through this simple treemap. We can see where the lion's share of the money goes and which areas receive relatively little funding. Click HERE to see the interactive version which provides more information when you scroll over or click on a rectangle. Treemaps are easy to make in Tableau, Excel, and other apps.

School District of Philadelphia Budget

I find this sunburst chart daunting in static form. But check out the interactive version HERE. If you scroll over the inner ring, you can see that 96 percent of funds went to school budgets. Then move to successive outer rings to see how school and administrative budgets break down into smaller categories. You can build sunburst charts in Excel and other apps.

Oak Park, Illinois Budget

This interactive area chart showing the Oak Park, IL budget emphasizes change over time in the area chart at the top. But you can click on any year to see how the budget broke down by funds in the bar chart below. If you click on the downward arrow next to a given fund, you get even more detailed information on that fund. You can build this type of interactive viz in Tableau.

To see past data tips, including tips on other types of pantry staple data, click HERE.


Let’s talk about YOUR data!

Got the feeling that you and your colleagues would use your data more effectively if you could see it better? Data Viz for Nonprofits (DVN) can help you get the ball rolling with an interactive data dashboard and beautiful charts, maps, and graphs for your next presentation, report, proposal, or webpage. Through a short-term consultation, we can help you to clarify the questions you want to answer and goals you want to track. DVN then visualizes your data to address those questions and track those goals.


Understand Donations Using "Pantry Staple" Data

60-SECOND DATA TIP_3.gif

The vast majority of nonprofits have some type of list of donors and donations. Tell me that you don’t have a database or spreadsheet that looks something like this.

Screen Shot 2021-04-19 at 11.10.23 AM.png

Use Case: Tracking Progress to Goal

Now tell me that this data would not be way more useable in this interactive dashboard. Give it a try. You can see both how you are doing overall in relation to your goal and how different types of donors and donations are contributing to your progress. This dashboard can be created using Tableau Public, the free version of Tableau.

To see past data tips, including tips on other types of pantry staple data, click HERE.


Let’s talk about YOUR data!

Got the feeling that you and your colleagues would use your data more effectively if you could see it better? Data Viz for Nonprofits (DVN) can help you get the ball rolling with an interactive data dashboard and beautiful charts, maps, and graphs for your next presentation, report, proposal, or webpage. Through a short-term consultation, we can help you to clarify the questions you want to answer and goals you want to track. DVN then visualizes your data to address those questions and track those goals.


How to Put The Viewer In The Viz

60-SECOND DATA TIP_3 (2).gif

Here’s a surefire way to engage your donors, staff, board members, and others in your data: put them in it. I’ve talked about how to place the “viewer in the viz” before. And The New York Times recently reminded me just how powerful this strategy can be.

This series of interactive visualizations from The New York Times shows you, right out of the gates, whether you live in a Democratic or Republican bubble. Then it zooms out to zip code areas near you and finally focuses on the segregated political landscape in the U.S. more generally.

I recommend you interact with the NYT viz and let it inspire you. Think about how you can engage various stakeholders in your data by using a similar technique. For example, show viewers . . .

  • How close they are to a problem. Rather than present statistics on food insecurity in your region, ask viewers to enter their zip code to see how many families near them don’t have consistent access to healthy food.

  • How accurate their understanding of an issues is. Ask them how many women experience domestic abuse or how many children experience poverty, and then show them how far off the mark they are. Check out this example!

  • How their habits or lifestyle contribute to—or help to reduce—a problem. Check out this Carbon Footprint Calculator for a great example.

  • What category they fall into. We all love to discover groups we belong to. Think of Harry Potter’s sorting hat. Consider elucidating an issue by showing viewers where they fall in relation to that issue. That’s what I did with this data personality viz.

And no, you don’t need to be a tech wiz to make these types of interactive visualizations. You can make them using Tableau Public, the free version of Tableau (or a similar data viz application) and embed them in your website. I’m also happy to create something like this for you.


Let’s talk about YOUR data!

Got the feeling that you and your colleagues would use your data more effectively if you could see it better? Data Viz for Nonprofits (DVN) can help you get the ball rolling with an interactive data dashboard and beautiful charts, maps, and graphs for your next presentation, report, proposal, or webpage. Through a short-term consultation, we can help you to clarify the questions you want to answer and goals you want to track. DVN then visualizes your data to address those questions and track those goals.


Understand Your Volunteers Using "Pantry Staple" Data

60-SECOND DATA TIP_3 (1).gif

If your organization is like most nonprofits, you rely on volunteers to get the job done. And you probably have at least some basic “pantry staple” data on volunteers.

Pantry Staple Data: Volunteer Data

The volunteer data you already have can be leveraged to:

  • Impress funders, donors, and other stakeholders. Show them how you are using this free resource to move the needle.

  • Recruit new volunteers. As we have discussed in this blog before, we are all influenced by peers. So show how many volunteers you have to attract even more.

  • Manage volunteers more effectively. Seeing clearly what’s going on with your volunteers will help you to retain them, make better use of them, and recruit new ones. This is the subject of today’s tip.

Use Case: Maximizing Volunteer Time and Value

This volunteer data dashboard uses a variety of charts to answer the who, what, where, and when questions that you may have about your volunteers. With this detailed view of volunteers, an organization can start thinking about how to activate inactive volunteers, what types of new volunteers to target, and when during the year to deploy volunteers.

Source: Jin Tat on Tableau Public

Source: Jin Tat on Tableau Public

This simple map dashboard provides insight into the distribution of volunteers—and volunteer hours—among sites. This understanding can help you decide if and how to redistribute volunteers. Both this dashboard and the one above can be created using Tableau Public, the free version of Tableau.

Source:CCE on Tableau Public

Source:CCE on Tableau Public

To see past data tips, click HERE.


Let’s talk about YOUR data!

Got the feeling that you and your colleagues would use your data more effectively if you could see it better? Data Viz for Nonprofits (DVN) can help you get the ball rolling with an interactive data dashboard and beautiful charts, maps, and graphs for your next presentation, report, proposal, or webpage. Through a short-term consultation, we can help you to clarify the questions you want to answer and goals you want to track. DVN then visualizes your data to address those questions and track those goals.


How To Show The Real People Behind The Data

60-SECOND DATA TIP_3 (1).png

Data visualizations can provide something that photos and case studies—for all of their visceral appeal—cannot. Context. Charts, maps, and graphs give us the critical context that we cannot see in a photo or in a story about one person, such as how prevalent a problem is, where it is occurring, or the impact of a program over time.

Data visualizations, of course, also have a downside. A chart, map, or graph is an abstraction that aggregates the stories of many individuals. And, as Joshua Smith points out: “It’s really hard to tell a powerful story in aggregate when all of the humans and all of their lives and moments and emotions are plotted under a single data point, often represented through a behavioral variable, e.g. “sales”, or “likes”. In aggregate, we lose all the parts and pieces that make characters relatable and memorable.”

So can we have the best of both worlds? Can we put photos and other information about real people into data visualizations? Yes! Consider one of these strategies.

Follow Individuals Through The Data

The idea is to explain an issue, a problem, or a situation through the stories of select individuals. Ludovic Tavernier explains the the situation of Somali refugees through the stories of two Somali women. Ayaan and Shamshi, in a series of visualizations entitled Two Years Late. Tavernier labels particular data points to show where Ayaan and Shamshi fit into the larger picture.

Source: Ludovic Tavernier (on Tablea Public)

Source: Ludovic Tavernier (on Tablea Public)

Dot = Person

Another approach is to make each mark (e.g. dot, square, bar) represent an actual person and allow the viewer to scroll over marks to learn more about these individuals. This is Eve Thomas’ strategy in Stop and Search which shows the disproportionate rate at which Black people are stopped and searched in London.

Source: Eve Thomas (on Tableau Public)

Source: Eve Thomas (on Tableau Public)

Here’s another example from JR Copreros in which each dot represents a real person who was convicted of a crime and later exonerated.

Source: JR Copreros (on Tableau Public)

Source: JR Copreros (on Tableau Public)

Show Both The Forest and The Trees

Perhaps the simplest strategy is to include both aggregated data (the forest) and disaggregated data (the trees) in the same visualization. The chart below shows the number of absences for both individual students and the average number of absences across all students.

revamp.png

Filter Charts By Individuals

Another way to zoom in on particular trees is to include a filter that allows you to show results for just one person. This visualization by David Borczuk allows you to choose just one woman in Madagascar who suffered from obstetric fistula, a medical condition in which a hole develops in the birth canal as a result of childbirth.

Source: David Borczuk (on Tableau Public)

Source: David Borczuk (on Tableau Public)

On the lighter side, you can click on any character in Glee to learn more about that character in various charts in this data dashboard by Jennifer Dawes.

To see past data tips, click HERE.


Let’s talk about YOUR data!

Got the feeling that you and your colleagues would use your data more effectively if you could see it better? Data Viz for Nonprofits (DVN) can help you get the ball rolling with an interactive data dashboard and beautiful charts, maps, and graphs for your next presentation, report, proposal, or webpage. Through a short-term consultation, we can help you to clarify the questions you want to answer and goals you want to track. DVN then visualizes your data to address those questions and track those goals.


How to Show Problems and Solutions in One Chart

Data Tips.png

Data visualizations are kind of like beards or kale. They used to be decidedly uncool, but are now hip, at least in certain circles. Yet, even with the rising popularity of charts, maps, and graphs, I think many of us have a faint feeling of aversion when encountering them. For one, they may be hard to decipher. But there’s another problem too. They often are the bearers of bad news. They show us how widespread a problem is or how it’s increasing. Worse, they rarely give us any hope of improvement.

Wouldn’t charts, maps, and graphs be more engaging and helpful if they showed both problems AND solutions? Let’s talk about how to get that done.

Show Two Scenarios

Show the difference between how things play out with and without an intervention or program. The now-famous flatten the curve graph (shown below) did this without any real data. The point was just to show how the number of cases would likely differ with and without public health measures to slow the spread of COVID.

Source: C.T. Bergstrom

Here’s a graph that shows two scenarios with real data. The data point labels are particularly helpful in this example. By comparing two different cities, the graph suggests that a delay in the start of social distancing interventions may have a huge effect on the severity of an outbreak.

Show A Change In The Trend

Another way to present a problem along with a solution is to show how a trend alters following an intervention. This graph shows projected data for several types of interventions: the current policy, alternative policies, and the absence of policies. In the absence of policies, global warming is expected to reach 4.1°C – 4.8°C above pre-industrial levels by the end of the century. Current policies are projected to result in about a 3.0° rise over pre-industrial levels. Other pledges and targets that governments have made would limit warming to even lower amounts.

This one effectively uses bubble size and color to show a trend alteration following the introduction of the measles vaccine.

Source: Sciencemag.org

On the uncool-to-very-cool spectrum, data visualizations that show both problems and solutions are very cool. To see what other things are cool/uncool check out CoolnessGraphed.com.

To see past data tips, including those about other chart types, click HERE.


Let’s talk about YOUR data!

Got the feeling that you and your colleagues would use your data more effectively if you could see it better? Data Viz for Nonprofits (DVN) can help you get the ball rolling with an interactive data dashboard and beautiful charts, maps, and graphs for your next presentation, report, proposal, or webpage. Through a short-term consultation, we can help you to clarify the questions you want to answer and goals you want to track. DVN then visualizes your data to address those questions and track those goals.


How To Use Big A** Numbers

60-SECOND DATA TIP_3 (1).png

You already know about BANs even if you don’t think you do. They are Big Ass Numbers meant to catch your attention. You see them everywhere these days, featured in bold fonts on websites, brochures, and reports; sprinkled throughout PowerPoint presentations; and arrayed as KPIs* in data dashboards.

BANs are having a moment. And they can be powerful. But watch out for overdoing it. When lots of BANs crowd a single display, they steal each other’s limelight and bewilder the audience. Anyone who gives a BAN a moment’s thought might wonder: “Wow, 5,000 meals sounds like a lot, but what is the need? What do similar organizations provide?”

So use BANs sparingly and give them space so they can shine. Also, provide context when possible: “5,000 meals served and no one turned away.”

Steve Wexler also advises using one or two BANs when they provide a good overall summary of a lot of data and when they clarify and provide context for subsequent charts, maps, and graphs.

And for some great ways to design BANs, check out Adam McCann’s 20 Ways to Visualize KPIs.

See other data tips in this series for more information on how to effectively visualize and make good use of your organization's data. 

*key performance indicators

How To Show Your Organization's Pre- and Post-COVID Data

60-SECOND DATA TIP_3 (1).gif

It’s time to reconsider your plans for showing progress in 2020. The chart, map, or graph you planned to use on your website, in your annual report, or at the quarterly board meeting may no longer apply or may tell the wrong story. The lives of those you serve and the way you serve them probably have changed. The question is: how can you show progress and provide enough context so that viewers get it right and get it quickly. Below are some ideas. If your organization has come up with other solutions, please let me know, and I’ll share them in a future data tip.

1.png

1. Distinguish pre- and post-COVID periods

This is the simplest solution. Make sure to distinguish the COVID period in your charts using color, shading, borders, and captions. Viewers will expect to see differences between pre- and post-COVID periods. So show them where to apply these different expectations.

Copy of Add a heading.png

2. Emphasize COVID period

You might consider emphasizing the COVID period by enlarging it and showing an adjusted goal for this time. Even if your service capacity has decreased, you could be doing well compared to adjusted goals.

3.png

3. Discourage pre/post comparisons

In some cases, you may want to discourage pre- and post-COVID comparisons given how much circumstances have changed. You might show only the COVID period, perhaps along with an adjusted goal reference line.

Copy of Add a heading (1).png

4. Focus on adaptation over time

Although some programs and services may have come to a screeching halt, others may have ramped up speedily. There are plenty of ways to show these changes in charts that clearly distinguish both periods.


To see past data tips, including those about other chart types, click HERE.


Let’s talk about YOUR data!

Got the feeling that you and your colleagues would use your data more effectively if you could see it better? Data Viz for Nonprofits (DVN) can help you get the ball rolling with an interactive data dashboard and beautiful charts, maps, and graphs for your next presentation, report, proposal, or webpage. Through a short-term consultation, we can help you to clarify the questions you want to answer and goals you want to track. DVN then visualizes your data to address those questions and track those goals.