
“Every artist gets asked the question: ‘Where do you get your ideas?’ The honest artist answers, ‘I steal them.’ . . . What a good artist understands is that nothing comes from nowhere. All creative work builds on what came before.” —Austin Kleon in Steal Like An Artist.
Recently, I recommended that you steal ideas from this data viz . Today I offer up another steal-worthy interactive viz that I came across in the Tableau Public Gallery.
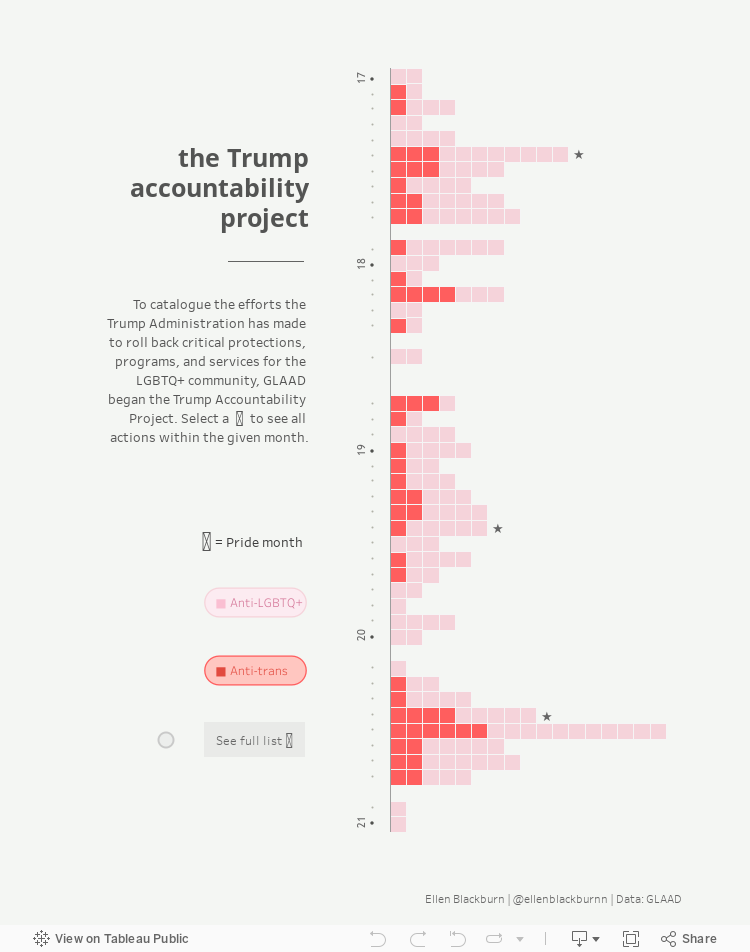
Source: Ellen Blackburn on Tableau Public
Here’s what I suggest you steal from this viz:
Vertical Timeline. The vertical timeline looks cool and works better than a horizontal one on a phone screen.
Self-Explanatory Chart. Each action by the Trump Administration is represented by a square. I would have stated this in the subtitle, but I think the chart is pretty self-explanatory once you begin interacting with it (give it a try). It’s easy to see when there were more or fewer actions and what proportion of actions are considered anti-LGBTQ+ and anti-trans.
Detail on Demand. When you scroll over the squares, you get a lot more detail on the particular actions. But none of this detail is visible until you start scrolling. So the details do not obscure the overall patterns and change over time.
Controlled color palette. Using just two colors for the squares and one color for the text lets the patterns shine through. Also, the off-white background looks like a piece of paper, making the viz seem more approachable.
To see past data tips, click HERE.
Let’s talk about YOUR data!
Got the feeling that you and your colleagues would use your data more effectively if you could see it better? Data Viz for Nonprofits (DVN) can help you get the ball rolling with an interactive data dashboard and beautiful charts, maps, and graphs for your next presentation, report, proposal, or webpage. Through a short-term consultation, we can help you to clarify the questions you want to answer and goals you want to track. DVN then visualizes your data to address those questions and track those goals.


