10 Essential Data Facts For Non-Data People (Fact #9)

I’m posting comic strips explaining ten essential data facts for non-data people over time. Check out other data facts which have been posted so far by scrolling down or clicking HERE.


Let’s talk about YOUR data!

Got the feeling that you and your colleagues would use your data more effectively if you could see it better? Data Viz for Nonprofits (DVN) can help you get the ball rolling with an interactive data dashboard and beautiful charts, maps, and graphs for your next presentation, report, proposal, or webpage. Through a short-term consultation, we can help you to clarify the questions you want to answer and goals you want to track. DVN then visualizes your data to address those questions and track those goals.


10 Essential Data Facts For Non-Data People (Fact #8)

I’m posting comic strips explaining ten essential data facts for non-data people over time. Check out other data facts which have been posted so far by scrolling down or clicking HERE.


Let’s talk about YOUR data!

Got the feeling that you and your colleagues would use your data more effectively if you could see it better? Data Viz for Nonprofits (DVN) can help you get the ball rolling with an interactive data dashboard and beautiful charts, maps, and graphs for your next presentation, report, proposal, or webpage. Through a short-term consultation, we can help you to clarify the questions you want to answer and goals you want to track. DVN then visualizes your data to address those questions and track those goals.


10 Essential Data Facts For Non-Data People (Fact #7)

I’m posting comic strips explaining ten essential data facts for non-data people over time. Check out other data facts which have been posted so far by scrolling down or clicking HERE.


Let’s talk about YOUR data!

Got the feeling that you and your colleagues would use your data more effectively if you could see it better? Data Viz for Nonprofits (DVN) can help you get the ball rolling with an interactive data dashboard and beautiful charts, maps, and graphs for your next presentation, report, proposal, or webpage. Through a short-term consultation, we can help you to clarify the questions you want to answer and goals you want to track. DVN then visualizes your data to address those questions and track those goals.


10 Essential Data Facts For Non-Data People (Fact #6)

I’m posting comic strips explaining ten essential data facts for non-data people over time. Check out other data facts which have been posted so far by scrolling down or clicking HERE.


Let’s talk about YOUR data!

Got the feeling that you and your colleagues would use your data more effectively if you could see it better? Data Viz for Nonprofits (DVN) can help you get the ball rolling with an interactive data dashboard and beautiful charts, maps, and graphs for your next presentation, report, proposal, or webpage. Through a short-term consultation, we can help you to clarify the questions you want to answer and goals you want to track. DVN then visualizes your data to address those questions and track those goals.


10 Essential Data Facts For Non-Data People (Fact #5)

Source: Tuomi, Ilkka (2000). "Data is more than knowledge". Journal of Management Information Systems. 6 (3): 103–117. doi:10.1080/07421222.1999.11518258.

I’m posting comic strips explaining ten essential data facts for non-data people over time. Check out other data facts which have been posted so far by scrolling down or clicking HERE.


Let’s talk about YOUR data!

Got the feeling that you and your colleagues would use your data more effectively if you could see it better? Data Viz for Nonprofits (DVN) can help you get the ball rolling with an interactive data dashboard and beautiful charts, maps, and graphs for your next presentation, report, proposal, or webpage. Through a short-term consultation, we can help you to clarify the questions you want to answer and goals you want to track. DVN then visualizes your data to address those questions and track those goals.


10 Essential Data Facts For Non-Data People (Fact #4)

I’m posting comic strips explaining ten essential data facts for non-data people over time. Check out other data facts which have been posted so far by scrolling down or clicking HERE.


Let’s talk about YOUR data!

Got the feeling that you and your colleagues would use your data more effectively if you could see it better? Data Viz for Nonprofits (DVN) can help you get the ball rolling with an interactive data dashboard and beautiful charts, maps, and graphs for your next presentation, report, proposal, or webpage. Through a short-term consultation, we can help you to clarify the questions you want to answer and goals you want to track. DVN then visualizes your data to address those questions and track those goals.


How Data Viz Can Save Your Thanksgiving

Your next data challenge may involve turkey. And I’m here to help. This week we take a break from nonprofit data and consider Thanksgiving data.

Thanksgiving involves many more dishes than you would normally serve in one meal. If you are in charge this year, and you have a medium to small oven and fridge, you have to be strategic. When should you cook, chill, and reheat each dish to make the most of your time and limited oven/fridge space?

I give you my Thanksgiving Game Plan Gantt Chart (partially pictured below) originally shared in tip #87. It has become a Thanksgiving tradition here at Data Viz for Nonprofits, and works like a charm. I made it in Google Sheets. Nothing fancy, but it does the trick. Feel free to adapt it to your recipes or perhaps your next fundraising event!

Happy Turkey/Tofurky Day. And stay tuned. Next week we will return to the series of data tip comic strips on essential data facts for non-data people.


Let’s talk about YOUR data!

Got the feeling that you and your colleagues would use your data more effectively if you could see it better? Data Viz for Nonprofits (DVN) can help you get the ball rolling with an interactive data dashboard and beautiful charts, maps, and graphs for your next presentation, report, proposal, or webpage. Through a short-term consultation, we can help you to clarify the questions you want to answer and goals you want to track. DVN then visualizes your data to address those questions and track those goals.


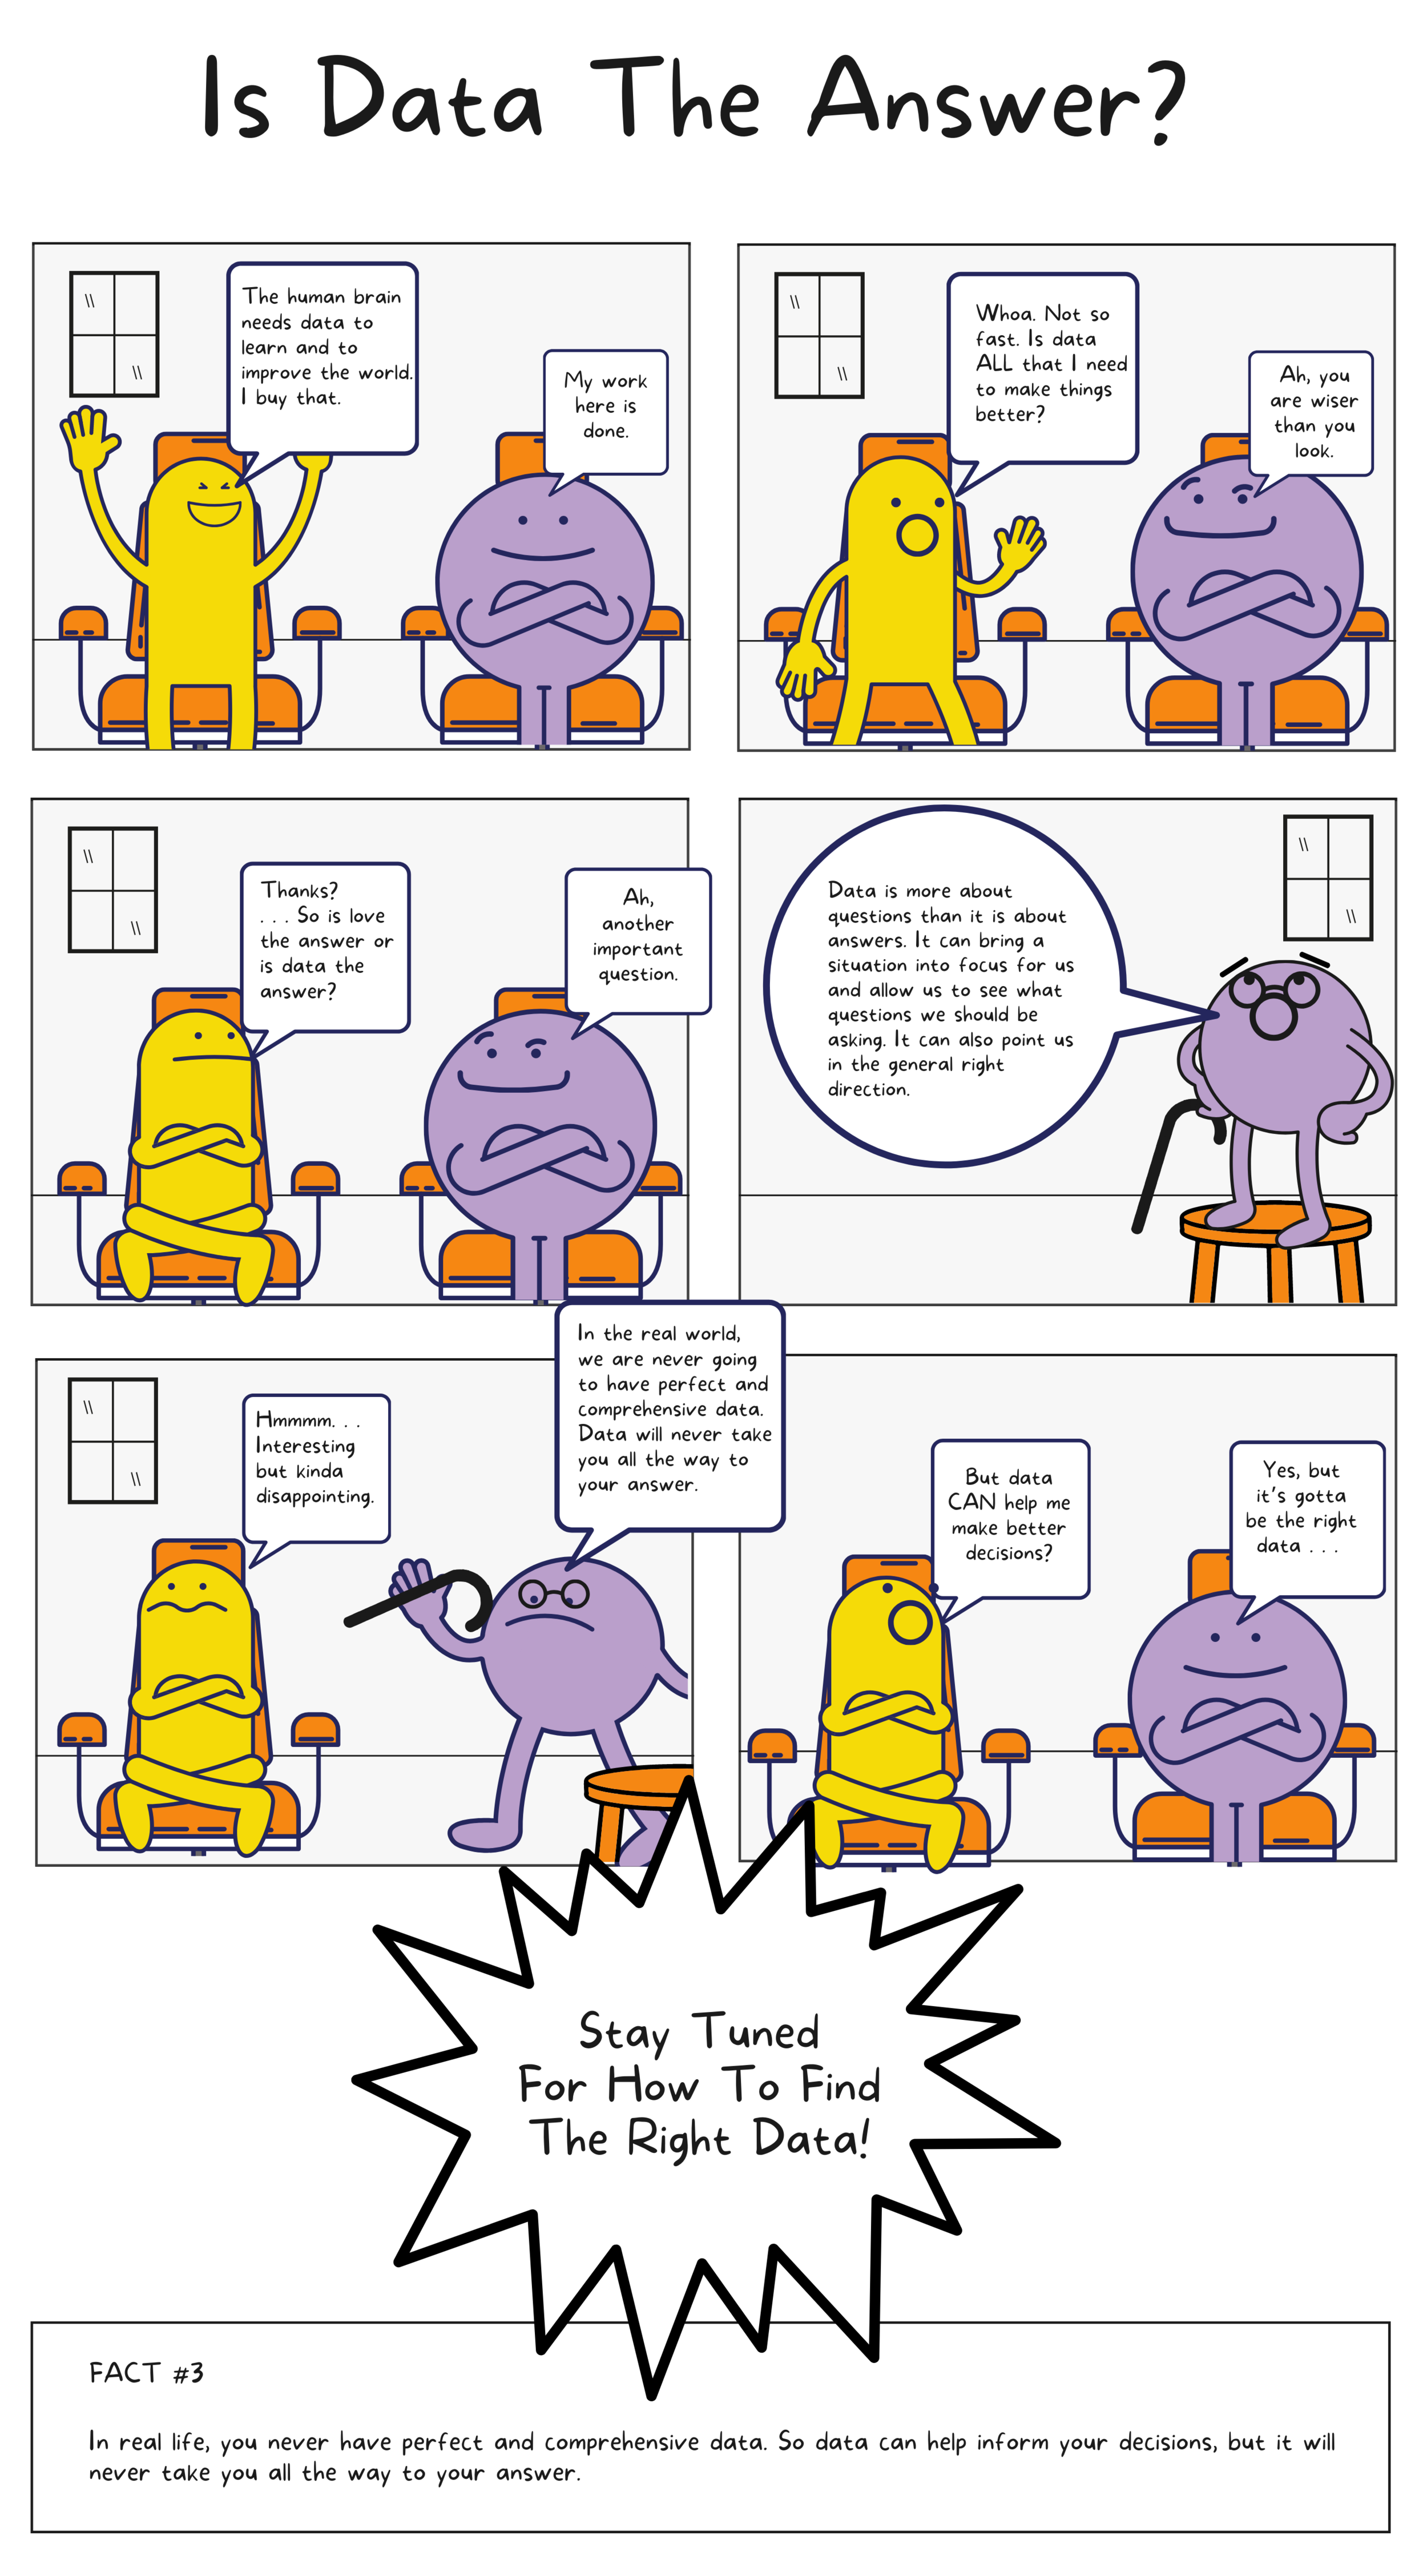
10 Essential Data Facts For Non-Data People (Fact #3)

I’m posting comic strips explaining ten essential data facts for non-data people over time. Check out other data facts which have been posted so far by scrolling down or clicking HERE.


Let’s talk about YOUR data!

Got the feeling that you and your colleagues would use your data more effectively if you could see it better? Data Viz for Nonprofits (DVN) can help you get the ball rolling with an interactive data dashboard and beautiful charts, maps, and graphs for your next presentation, report, proposal, or webpage. Through a short-term consultation, we can help you to clarify the questions you want to answer and goals you want to track. DVN then visualizes your data to address those questions and track those goals.


10 Essential Data Facts For Non-Data People (Fact #2)

I’m posting comic strips explaining ten essential data facts for non-data people over time. Check out other data facts which have been posted so far by scrolling down or clicking HERE.


Let’s talk about YOUR data!

Got the feeling that you and your colleagues would use your data more effectively if you could see it better? Data Viz for Nonprofits (DVN) can help you get the ball rolling with an interactive data dashboard and beautiful charts, maps, and graphs for your next presentation, report, proposal, or webpage. Through a short-term consultation, we can help you to clarify the questions you want to answer and goals you want to track. DVN then visualizes your data to address those questions and track those goals.


10 Essential Data Facts For Non-Data People (Fact #1)

Sources: OECD Glossary of Statistical Terms. OECD. 2008. p. 119. ISBN 978-92-64-025561. and Tuomi, Ilkka (2000). "Data is more than knowledge". Journal of Management Information Systems. 6 (3): 103–117. doi:10.1080/07421222.1999.11518258.

Sources: OECD Glossary of Statistical Terms. OECD. 2008. p. 119. ISBN 978-92-64-025561. and Tuomi, Ilkka (2000). "Data is more than knowledge". Journal of Management Information Systems. 6 (3): 103–117. doi:10.1080/07421222.1999.11518258.

I’m posting comic strips explaining ten essential data facts for non-data people over time. Check out other data facts which have been posted so far by scrolling down or clicking HERE.


Let’s talk about YOUR data!

Got the feeling that you and your colleagues would use your data more effectively if you could see it better? Data Viz for Nonprofits (DVN) can help you get the ball rolling with an interactive data dashboard and beautiful charts, maps, and graphs for your next presentation, report, proposal, or webpage. Through a short-term consultation, we can help you to clarify the questions you want to answer and goals you want to track. DVN then visualizes your data to address those questions and track those goals.


When Is Nothing Something You Should Show?

Reposted from July 13, 2020

Reposted from July 13, 2020

Data visualization is all about making what’s invisible (or not-immediately-perceptible) in the outside world visible and clear. You can’t see the range and strength of your clients’ feelings about the programs you offer, but you can see them on a chart. You can’t see air pollution across thousands of miles, but you can see it on a map. In both of these examples, data visualizations show the presence of something. Can they also show the absence of something? And when is nothing something you really should show?

This cartoon from the start of the pandemic makes the absence of something — COVID cases averted by individual actions — perceptible with gray lines and dots. It got me thinking about how we visualize the absence of things in charts, maps, and graphs.

See animated version of the cartoon here.

A common problem in almost any endeavor involving data is “missing data.” This is data that was not collected because, for example, a respondent skipped a survey question or someone did not fill in a data field in a database. And often missing data is eliminated from charts, maps, and graphs. We don’t show what we don’t know. But that can be a mistake, especially when the majority of data is missing such as in this pie chart. By showing the amount of unknown and missing values, it emphasizes the need for better data collection so that we can understand which groups are most affected.

source: WBUR

These maps (from March 2020) stress the absence of certain policies rather than the presence of them.

source: Politico

The colors gray and white often are used to signify the absence of something. But this chart uses green to draw your attention to the times when NONE of Britain’s power was generated by coal, presumably helping to make for a greener environment.

source: The Guardian

Zero points on axes also help to show the absence of something. This chart emphasizes the point on the X-axis representing no bias with a red line.

Consider what absences may be instructive to your staff, board members, funders, clients, or participants. Perhaps it’s the absence of data or the absence of revenue or the absence of problems following an intervention or the absence of essential services in a community. Remember showing nothing can be just as enlightening as showing something.

To see past data tips, including those about other chart types, click HERE.


Let’s talk about YOUR data!

Got the feeling that you and your colleagues would use your data more effectively if you could see it better? Data Viz for Nonprofits (DVN) can help you get the ball rolling with an interactive data dashboard and beautiful charts, maps, and graphs for your next presentation, report, proposal, or webpage. Through a short-term consultation, we can help you to clarify the questions you want to answer and goals you want to track. DVN then visualizes your data to address those questions and track those goals.


Interesting Versus Actionable Data

60-SECOND DATA TIP_4 (3).gif

It’s easy to get lost in a sea of interesting data when what you really need is actionable data. As Oracle’s Nate Mayfield points out, you know when you’ve presented only interesting data when you get this type of response: “Oh, cool. Yeah, that's great to know.” On the other hand, if you hear “Oh, okay. I can definitely decide what to do now,” then you’ve presented actionable data.

The key to presenting actionable data is to ask specific—rather than broad—questions. And then design your charts, maps, and graphs to answer those narrower questions. Mayfield’s article focuses on the types of questions a business might ask. Let’s consider the types of questions a nonprofit might ask:

Interesting Questions.png

Mayfield notes that data dashboards that are designed for a wide range of users tend to address only interesting questions. “Because they are intended for a broad set of users, with a lot of filters, you can in theory answer a lot of questions with these sprawling dashboards,” says Mayfield. “The problem is people quickly get lost in them and don’t spend the time required to answer their questions.” Instead, Mayfield advises us to create simple dashboards that answer quite specific questions such as the actionable questions above. So consider a series of simple dashboards, each designed to provide answers that prompt action for a particular type of user.

To see past data tips, including tips on other types of pantry staple data, click HERE.


Let’s talk about YOUR data!

Got the feeling that you and your colleagues would use your data more effectively if you could see it better? Data Viz for Nonprofits (DVN) can help you get the ball rolling with an interactive data dashboard and beautiful charts, maps, and graphs for your next presentation, report, proposal, or webpage. Through a short-term consultation, we can help you to clarify the questions you want to answer and goals you want to track. DVN then visualizes your data to address those questions and track those goals.


Before Showing A Percentage, Read This

60-SECOND DATA TIP_4 (1).png

Here’s what I’m going to do in 60 seconds today:

  • Give you three percentages. They might be the type of percentages that you share in proposals, reports, your website, or in social media posts.

  • Give you the backstory on these percentages.

  • Convince you to think carefully next time you want to present a percentage.

Here goes.

#1: Two percent of clients in Program A dropped out in the first three days of the program.

#2: 60% of first time donors in March made a second gift.

#3: 25% of people who attended our XYZ event said that they were unlikely or very unlikely to recommend the event to others.

And here is the backstory on each of the percentages:

#1: Two percent of clients in Program A dropped out in the first three days of the program. Backstory: There were 50 participants in Program A. That means only one person dropped out.

#2: 60% of first time donors in March made a second gift. Backstory: There were 5 new donors in March. That means that 3 made second gifts.

#3: 25% of people who attended our XYZ event said that they were unlikely or very unlikely to recommend the event to others. Backstory: Eight people attended XYZ event. That means two people provided the low rating.

Did the backstories cast a different light on the percentages for you? Perhaps you were imagining more people were involved? When the numerator or the denominator is fairly small, it’s usually best to present both in raw numbers rather than give a percentage. The raw numbers present a clearer understanding of the situation that you’re trying to describe. In fact, when numbers are small, percentages can be downright misleading.


Let’s talk about YOUR data!

Got the feeling that you and your colleagues would use your data more effectively if you could see it better? Data Viz for Nonprofits (DVN) can help you get the ball rolling with an interactive data dashboard and beautiful charts, maps, and graphs for your next presentation, report, proposal, or webpage. Through a short-term consultation, we can help you to clarify the questions you want to answer and goals you want to track. DVN then visualizes your data to address those questions and track those goals.


Invisible Assumptions Driving Your Organization

Reposted from January 7, 2020

Reposted from January 7, 2020

People and organizations have ideas about what leads to what. We are aware of some of these ideas. But others are so ingrained that we mistake them for facts of life.

Psychologists call the visible ideas explicit theories and the invisible ones implicit theories. Both explicit and implicit theories affect how we perceive and act in the world. If, for example, we believe—either explicitly or implicitly--that hard work leads to success, we are more likely to perceive evidence that supports our theory (aka confirmation bias) and to work hard ourselves and encourage it in our offspring, clients, and employees.

If this idea is explicit, then we are more likely to examine it, compare it to the ideas of others, and even test it. However, if it’s implicit, then it will probably never occur to us to examine it because we are not fully aware that we believe it or that things could be any other way. (For more on implicit and explicit theories, check out this.)

Implicit theories also affect what data we gather and use. If we have an implicit hard work theory, we might gather data to assess what type of work or effort is most likely to lead to success but, unless we make the implicit theory explicit, we are not likely to collect data to see if clients who put in more training hours actually had more success.

Every organization has implicit theories. Do any of these seem familiar?

  • Meetings make people feel included/empowered.

  • With more money, we could be more effective.

  • Special events help to cultivate new donors.

Some of these assumptions might be true, at least under certain circumstances. But no matter how data-driven we are, we are not going to collect data to test ideas we are not fully aware of.

Staff meetings are great places to listen for implicit theories. Next time your colleagues and you are discussing an issue, see if you can detect a few of them. What assumptions lie behind your assessments, decisions, and actions?


Let’s talk about YOUR data!

Got the feeling that you and your colleagues would use your data more effectively if you could see it better? Data Viz for Nonprofits (DVN) can help you get the ball rolling with an interactive data dashboard and beautiful charts, maps, and graphs for your next presentation, report, proposal, or webpage. Through a short-term consultation, we can help you to clarify the questions you want to answer and goals you want to track. DVN then visualizes your data to address those questions and track those goals.


Photo by PoL Úbeda Hervàs flickr.com/photos/polubeda/


How To Showcase Your Sites With An Interactive Map

60-SECOND DATA TIP_3 (4).png

Here’s a viz you can use. It is interactive, can be built in Tableau Public for free, and can be embedded in your website. This example shows affordable housing sites. Give it a try below and check out these features:

  • The circles on the map show the location of the sites. The color of the circles show the type of site, and the size of the circles indicates number of units (but you can size your circles by any measure such as number of people served or programs offered.)

  • Click on a site on the map to see more information, to the right, about the site including a photo.

  • When you click on a site, it is also highlighted on the chart below so you can compare that site to the others.

To learn how to create an interactive map with similar features in Tableau Public, check out this tutorial. I’d also be happy to build one for you, customized to your needs. Just click “Schedule A Free Consultation” below.

Let’s talk about YOUR data!

Got the feeling that you and your colleagues would use your data more effectively if you could see it better? Data Viz for Nonprofits (DVN) can help you get the ball rolling with an interactive data dashboard and beautiful charts, maps, and graphs for your next presentation, report, proposal, or webpage. Through a short-term consultation, we can help you to clarify the questions you want to answer and goals you want to track. DVN then visualizes your data to address those questions and track those goals.


Can Excel Actually Be Fun?

Great-Graphs-Design-Principles_Making-the-Case-GIF.gif

This week’s quick tip is to check out Ann Emery’s excellent course on extracting the full power of Excel. If you register using the link below, you'll ALSO get bonus content from guest experts including me! The additional 50 lessons come from a team of more than a dozen guest experts about Tableau, R, one-pagers, UX, PowerPoint, photographs, report covers, tables, and more.

Learn more and register HERE by September 17, 2021.

What’s Included:

  • 180+ video lessons that you can watch anytime

  • Step-by-step instructions for making beginner, intermediate, and advanced graphs in Excel

  • 20+ templates to download and follow along

  • Office Hours (almost) every week in 2020 and 2021 to talk about your projects

  • 7 additional Live Trainings just for participants in this cohort

  • Discussion boards to interact with fellow dataviz enthusiasts

  • Private Data Vizards community of fellow participants

  • Weekly emails to cheer you on

  • Lifetime access so you don't feel rushed

  • Examples from a variety of industries (public health, juvenile justice, museums, and more)

  • Behind-the-scenes Excel magic tricks guaranteed to make your jaw drop

  • Early bird bonuses like 1:1 consultations and Swag Bags

How to Show Problems and Solutions in One Chart

Reposted from September 16,  2020

Reposted from September 16, 2020

Data visualizations are kind of like beards or kale. They used to be decidedly uncool, but are now hip, at least in certain circles. Yet, even with the rising popularity of charts, maps, and graphs, I think many of us have a faint feeling of aversion when encountering them. For one, they may be hard to decipher. But there’s another problem too. They often are the bearers of bad news. They show us how widespread a problem is or how it’s increasing. Worse, they rarely give us any hope of improvement.

Wouldn’t charts, maps, and graphs be more engaging and helpful if they showed both problems AND solutions? Let’s talk about how to get that done.

Show Two Scenarios

Show the difference between how things play out with and without an intervention or program. The now-famous flatten the curve graph (shown below) did this without any real data. The point was just to show how the number of cases would likely differ with and without public health measures to slow the spread of COVID.

Here’s a graph that shows two scenarios with real data. The data point labels are particularly helpful in this example. By comparing two different cities, the graph suggests that a delay in the start of social distancing interventions may have a huge effect on the severity of an outbreak.

Show A Change In The Trend

Another way to present a problem along with a solution is to show how a trend alters following an intervention. This graph shows projected data for several types of interventions: the current policy, alternative policies, and the absence of policies. In the absence of policies, global warming is expected to reach 4.1°C – 4.8°C above pre-industrial levels by the end of the century. Current policies are projected to result in about a 3.0° rise over pre-industrial levels. Other pledges and targets that governments have made would limit warming to even lower amounts.

This one effectively uses bubble size and color to show a trend alteration following the introduction of the measles vaccine.

On the uncool-to-very-cool spectrum, data visualizations that show both problems and solutions are very cool. To see what other things are cool/uncool check out CoolnessGraphed.com.

To see past data tips, including those about other chart types, click HERE.


Let’s talk about YOUR data!

Got the feeling that you and your colleagues would use your data more effectively if you could see it better? Data Viz for Nonprofits (DVN) can help you get the ball rolling with an interactive data dashboard and beautiful charts, maps, and graphs for your next presentation, report, proposal, or webpage. Through a short-term consultation, we can help you to clarify the questions you want to answer and goals you want to track. DVN then visualizes your data to address those questions and track those goals.


How to Show Your Progress With Color Alone

60-SECOND DATA TIP_3.png

"Color is a power which directly influences the soul." -Wassily Kandinsky

It’s August, so it seems appropriate to talk about heat maps. I’ve blogged about this simple yet powerful chart type before. It takes advantage of the power of color like no other chart I know. Heat maps use variations in color to show differences among categories (e.g. people living in different zip codes) or differences across a scale (e.g. people with different income levels). In a lot of cases, it’s simply a table with color added to the cells.

The enormous potential of a heat map is clear in Philip Bump’s recent heat map in The Washington Post, which took its inspiration from Thomas Wood’s similar chart. As Bump notes, this chart is “elegantly simple.” The rows are states, grouped by region. The columns are presidential election years. And shades of red and blue indicate the parties of candidates who won in each state, with darker shades indicating wider margins. Here’s part of the chart:

Source: The Washington Post, August 24, 2021

Source: The Washington Post, August 24, 2021

By carefully grouping the states into regions and subregions, the chart reveals interesting patterns: shifts from blue to red (and vice versa) as well as shifts from greater to lesser margins (and vice versa).

Think about how you can show change over time in the problems you are addressing or the services you are offering using color and strategic groupings. Here are some possible applications for organizations like yours:

  • Show shifts in service use over time among two (or more) groups such as adults represented by one color and children represented by another. Each row might be a zip code area and rows could be grouped by city.

  • Show changes in pollution over time produced by two (or more) sources such as vehicles represented by one color and factories by another. Each row might be a country and rows could be grouped by continent.

  • Show variation in client make up over time among two (or more) groups such as higher income groups represented by one color and lower income groups by another. Each row might be a program site and rows could be grouped by neighborhood.

You can create heat maps in many data viz programs. Here is how to create them in Excel and in Tableau.


Let’s talk about YOUR data!

Got the feeling that you and your colleagues would use your data more effectively if you could see it better? Data Viz for Nonprofits (DVN) can help you get the ball rolling with an interactive data dashboard and beautiful charts, maps, and graphs for your next presentation, report, proposal, or webpage. Through a short-term consultation, we can help you to clarify the questions you want to answer and goals you want to track. DVN then visualizes your data to address those questions and track those goals.


Ideas You Should Steal From This Viz (Installment 2)

60-SECOND DATA TIP_3.png

“Every artist gets asked the question: ‘Where do you get your ideas?’ The honest artist answers, ‘I steal them.’ . . . What a good artist understands is that nothing comes from nowhere. All creative work builds on what came before.” —Austin Kleon in Steal Like An Artist.

Recently, I recommended that you steal ideas from this data viz . Today I offer up another steal-worthy interactive viz that I came across in the Tableau Public Gallery.

Source: Ellen Blackburn on Tableau Public

Here’s what I suggest you steal from this viz:

  • Vertical Timeline. The vertical timeline looks cool and works better than a horizontal one on a phone screen.

  • Self-Explanatory Chart. Each action by the Trump Administration is represented by a square. I would have stated this in the subtitle, but I think the chart is pretty self-explanatory once you begin interacting with it (give it a try). It’s easy to see when there were more or fewer actions and what proportion of actions are considered anti-LGBTQ+ and anti-trans.

  • Detail on Demand. When you scroll over the squares, you get a lot more detail on the particular actions. But none of this detail is visible until you start scrolling. So the details do not obscure the overall patterns and change over time.

  • Controlled color palette. Using just two colors for the squares and one color for the text lets the patterns shine through. Also, the off-white background looks like a piece of paper, making the viz seem more approachable.

To see past data tips, click HERE.


Let’s talk about YOUR data!

Got the feeling that you and your colleagues would use your data more effectively if you could see it better? Data Viz for Nonprofits (DVN) can help you get the ball rolling with an interactive data dashboard and beautiful charts, maps, and graphs for your next presentation, report, proposal, or webpage. Through a short-term consultation, we can help you to clarify the questions you want to answer and goals you want to track. DVN then visualizes your data to address those questions and track those goals.


Why You Should Know About Bubble Charts

Reposted and Updated from January 21,  2020

Reposted and Updated from January 21, 2020

With so much depressing news, we could all use some bubbles right now. Even if they are only in chart form. This is a repost from a series of tips on different chart types. In each tip, l give you need-to-know information in a format akin to the “Drug Facts” on the back of medication boxes: active ingredients (what the chart is), uses (when to use it), and warnings (what to look out for when creating the chart). The idea is to fill up your toolbox with a variety of tools for making sense of data. This week, I (re)give you the bubble chart.

Active Ingredients (What is a bubble chart?)

A bubble chart is really just a souped-up scatterplot. Like the scatterplot, it’s a graph with plotted points that show the relationship between two sets of data. Here’s a scatter plot showing the relationship between the height and girth of black cherry trees:

We can see that there is a relationship between height and girth. As trees get taller, they also tend to get wider. The scatterplot becomes a bubble chart when we size the points according to another measure, in this case the volume of the trees.

Now we can see that as height and girth increase, the volume of black cherry trees also tends to increase. Sometimes folks add another measure or dimension to bubble charts using color, such as in this example.

Uses

Use a bubble chart when you want to show the relationship between two measures plus a bit more. In the bubble chart above, we can see that as the cost of smartphones (position on X-axis) increased, the growth in sales (position on Y-axis) decreased AND that sales were particularly high in China, Emerging Asia, and North America in 2017 (size of bubbles) AND that the boom markets with cheap phones were mainly emerging markets (color of bubbles). That’s a lot of information in a fairly small space.

Warnings

When you cram too much information into bubble charts, viewers struggle to see core relationships and trends. So don’t use too many data points, too many sizes, or too many colors. Scroll down to the end of this tip to see a bubble chart that confuses more than elucidates.

Put your most important measures on the X and Y axes. Remember that humans are really good at discerning position along a common scale. So viewers are most likely to comprehend the relationship between the X and Y measures first.

Show your less important measures or dimensions with size and color. Humans can only make general comparisons when it comes to size and color. We are hard pressed to say if one shade is twice as dark as another or if one circle is three times the size of another.

To see past data tips, including those about other chart types, click HERE.

There’s too much information in this bubble chart!

Source: European Beer Consumption | Mekko Graphics

I found most of these bubble charts on Grafiti.


Let’s talk about YOUR data!

Got the feeling that you and your colleagues would use your data more effectively if you could see it better? Data Viz for Nonprofits (DVN) can help you get the ball rolling with an interactive data dashboard and beautiful charts, maps, and graphs for your next presentation, report, proposal, or webpage. Through a short-term consultation, we can help you to clarify the questions you want to answer and goals you want to track. DVN then visualizes your data to address those questions and track those goals.