10 Essential Data Facts For Non-Data People: The Cheat Sheet

Reposted from January 2022

Here are ten data facts for non-data people who, nevertheless, have to deal with data sometimes (i.e. most of us). This is the cheat sheet. Click on the “Learn More” buttons for additional information served up in comic strip format!


Let’s talk about YOUR data!

Got the feeling that you and your colleagues would use your data more effectively if you could see it better? Data Viz for Nonprofits (DVN) can help you get the ball rolling with an interactive data dashboard and beautiful charts, maps, and graphs for your next presentation, report, proposal, or webpage. Through a short-term consultation, we can help you to clarify the questions you want to answer and goals you want to track. DVN then visualizes your data to address those questions and track those goals.


Don't Measure Impact . . . Wait, What?

Reposted from September 2022

Ghost of Christmas Yet To Come in The Chrismas Carol by Charles Dickens, Illustration by J. Leech, Source: Flickr

Most organizations should not waste time and money on impact evaluations. Measuring impact is difficult and expensive. It’s difficult because you need a good counterfactual. A counterfactual is what Dickens’s Ghost of Christmas Yet to Come shows Ebenezer Scrooge: what would happen if you did not change anything. The impact of an intervention or program is the difference between what happened and what would have happened without the intervention. Since, in the real world, you can’t observe the same group of beneficiaries with and without the intervention (as we do when we watch The Christmas Carol), you need a good proxy for the would-have-been condition. The best proxy is a group of potential beneficiaries that were randomly selected from a larger group of potential beneficiaries. These folks do not get the intervention. Then you can compare those who did and did not receive the intervention over time to estimate the impact of the intervention. This is called a randomized control trial or RCT.

Of course, withholding an intervention from potential beneficiaries can be a difficult and morally-questionable pursuit. And tracking a large group of beneficiaries and non-beneficiaries over time is expensive. This usually requires a team of skilled data collectors and analysts. Non-randomly-selected comparison groups are not nearly as good because they may differ from the intervention group in known or unknown ways. So it’s difficult to determine if the outcomes observed are due to the intervention itself or to pre-existing biases or characteristics. This costly and challenging process is further complicated by the need to start with a well-established intervention, one that has already worked out the kinks.

Due to the many challenges of measuring impact, most organizations should not waste time and money on impact evaluations. Instead, they should consider interventions that already have a strong research base, ideally because they have been rigorously tested with RCTs. (Check out: Where to Search for Evidence of Effective Programs.)

In a Stanford Social Innovation Review article, Mary Kay Gugerty and Dean Karlan suggest that, before beginning a new program, organizations ask: “What do other evaluations say about it? How applicable is the context under which those studies were done, and how similar is the intervention? Study the literature to see if there is anything that suggests your approach might be effective.”

Rather than assessing impact, your limited resources are better spent assessing implementation. You can do this by collecting data that shows whether what you planned is actually happening. If you can pinpoint where the problems are, you are in a better position to make fixes, alter plans, refine processes.  Many organizations make their plans using a logic model (aka theory of change). A logic model is a flow chart with inputs and outputs. The best logic models draw on past impact evaluations to determine what inputs are most likely to lead to what outputs. And organizations can easily assess progress to date by plugging their logic models into real time data. Interested? Read more about “living logic models” HERE.

To see past data tips, click HERE.


Let’s talk about YOUR data!

Got the feeling that you and your colleagues would use your data more effectively if you could see it better? Data Viz for Nonprofits (DVN) can help you get the ball rolling with an interactive data dashboard and beautiful charts, maps, and graphs for your next presentation, report, proposal, or webpage. Through a short-term consultation, we can help you to clarify the questions you want to answer and goals you want to track. DVN then visualizes your data to address those questions and track those goals.


10 Essential Data Facts For Non-Data People: The Cheat Sheet


Let’s talk about YOUR data!

Got the feeling that you and your colleagues would use your data more effectively if you could see it better? Data Viz for Nonprofits (DVN) can help you get the ball rolling with an interactive data dashboard and beautiful charts, maps, and graphs for your next presentation, report, proposal, or webpage. Through a short-term consultation, we can help you to clarify the questions you want to answer and goals you want to track. DVN then visualizes your data to address those questions and track those goals.


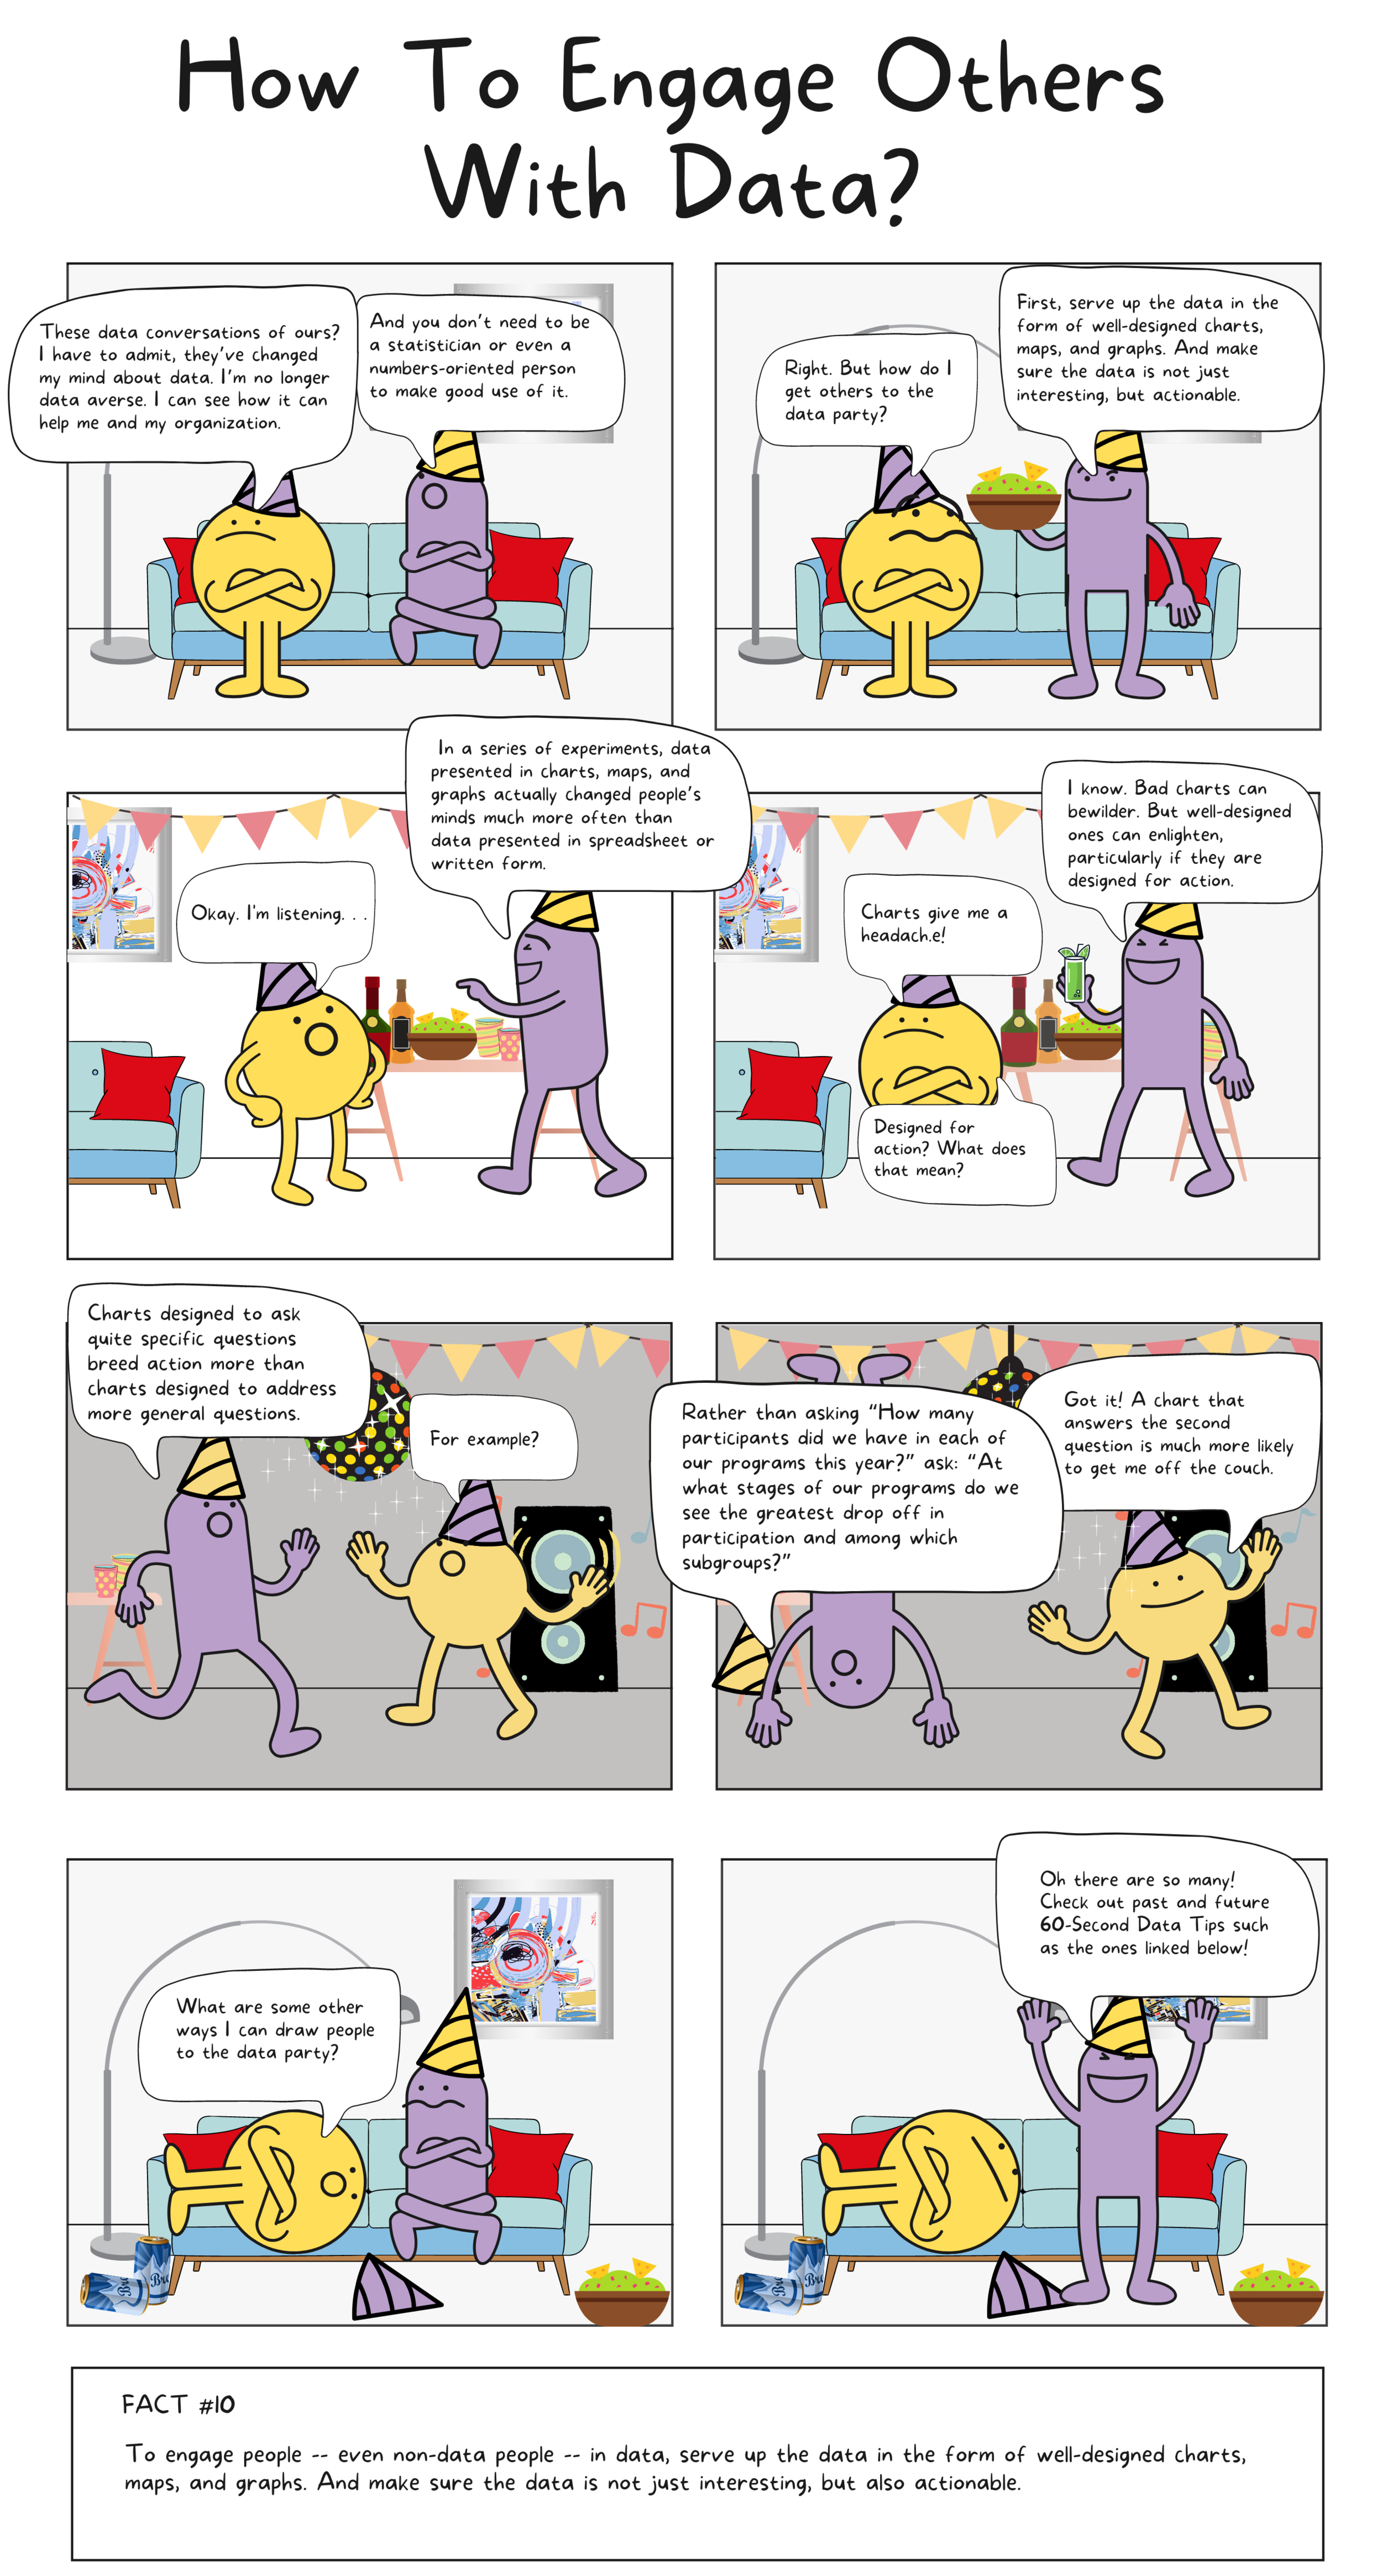
10 Essential Data Facts For Non-Data People (Fact #10)


Let’s talk about YOUR data!

Got the feeling that you and your colleagues would use your data more effectively if you could see it better? Data Viz for Nonprofits (DVN) can help you get the ball rolling with an interactive data dashboard and beautiful charts, maps, and graphs for your next presentation, report, proposal, or webpage. Through a short-term consultation, we can help you to clarify the questions you want to answer and goals you want to track. DVN then visualizes your data to address those questions and track those goals.


10 Essential Data Facts For Non-Data People (Fact #9)

I’m posting comic strips explaining ten essential data facts for non-data people over time. Check out other data facts which have been posted so far by scrolling down or clicking HERE.

Let’s talk about YOUR data!

Got the feeling that you and your colleagues would use your data more effectively if you could see it better? Data Viz for Nonprofits (DVN) can help you get the ball rolling with an interactive data dashboard and beautiful charts, maps, and graphs for your next presentation, report, proposal, or webpage. Through a short-term consultation, we can help you to clarify the questions you want to answer and goals you want to track. DVN then visualizes your data to address those questions and track those goals.


10 Essential Data Facts For Non-Data People (Fact #8)

I’m posting comic strips explaining ten essential data facts for non-data people over time. Check out other data facts which have been posted so far by scrolling down or clicking HERE.


Let’s talk about YOUR data!

Got the feeling that you and your colleagues would use your data more effectively if you could see it better? Data Viz for Nonprofits (DVN) can help you get the ball rolling with an interactive data dashboard and beautiful charts, maps, and graphs for your next presentation, report, proposal, or webpage. Through a short-term consultation, we can help you to clarify the questions you want to answer and goals you want to track. DVN then visualizes your data to address those questions and track those goals.


10 Essential Data Facts For Non-Data People (Fact #7)

I’m posting comic strips explaining ten essential data facts for non-data people over time. Check out other data facts which have been posted so far by scrolling down or clicking HERE.


Let’s talk about YOUR data!

Got the feeling that you and your colleagues would use your data more effectively if you could see it better? Data Viz for Nonprofits (DVN) can help you get the ball rolling with an interactive data dashboard and beautiful charts, maps, and graphs for your next presentation, report, proposal, or webpage. Through a short-term consultation, we can help you to clarify the questions you want to answer and goals you want to track. DVN then visualizes your data to address those questions and track those goals.


10 Essential Data Facts For Non-Data People (Fact #6)

I’m posting comic strips explaining ten essential data facts for non-data people over time. Check out other data facts which have been posted so far by scrolling down or clicking HERE.


Let’s talk about YOUR data!

Got the feeling that you and your colleagues would use your data more effectively if you could see it better? Data Viz for Nonprofits (DVN) can help you get the ball rolling with an interactive data dashboard and beautiful charts, maps, and graphs for your next presentation, report, proposal, or webpage. Through a short-term consultation, we can help you to clarify the questions you want to answer and goals you want to track. DVN then visualizes your data to address those questions and track those goals.


10 Essential Data Facts For Non-Data People (Fact #5)

Source: Tuomi, Ilkka (2000). "Data is more than knowledge". Journal of Management Information Systems. 6 (3): 103–117. doi:10.1080/07421222.1999.11518258.

I’m posting comic strips explaining ten essential data facts for non-data people over time. Check out other data facts which have been posted so far by scrolling down or clicking HERE.


Let’s talk about YOUR data!

Got the feeling that you and your colleagues would use your data more effectively if you could see it better? Data Viz for Nonprofits (DVN) can help you get the ball rolling with an interactive data dashboard and beautiful charts, maps, and graphs for your next presentation, report, proposal, or webpage. Through a short-term consultation, we can help you to clarify the questions you want to answer and goals you want to track. DVN then visualizes your data to address those questions and track those goals.


10 Essential Data Facts For Non-Data People (Fact #4)

I’m posting comic strips explaining ten essential data facts for non-data people over time. Check out other data facts which have been posted so far by scrolling down or clicking HERE.


Let’s talk about YOUR data!

Got the feeling that you and your colleagues would use your data more effectively if you could see it better? Data Viz for Nonprofits (DVN) can help you get the ball rolling with an interactive data dashboard and beautiful charts, maps, and graphs for your next presentation, report, proposal, or webpage. Through a short-term consultation, we can help you to clarify the questions you want to answer and goals you want to track. DVN then visualizes your data to address those questions and track those goals.


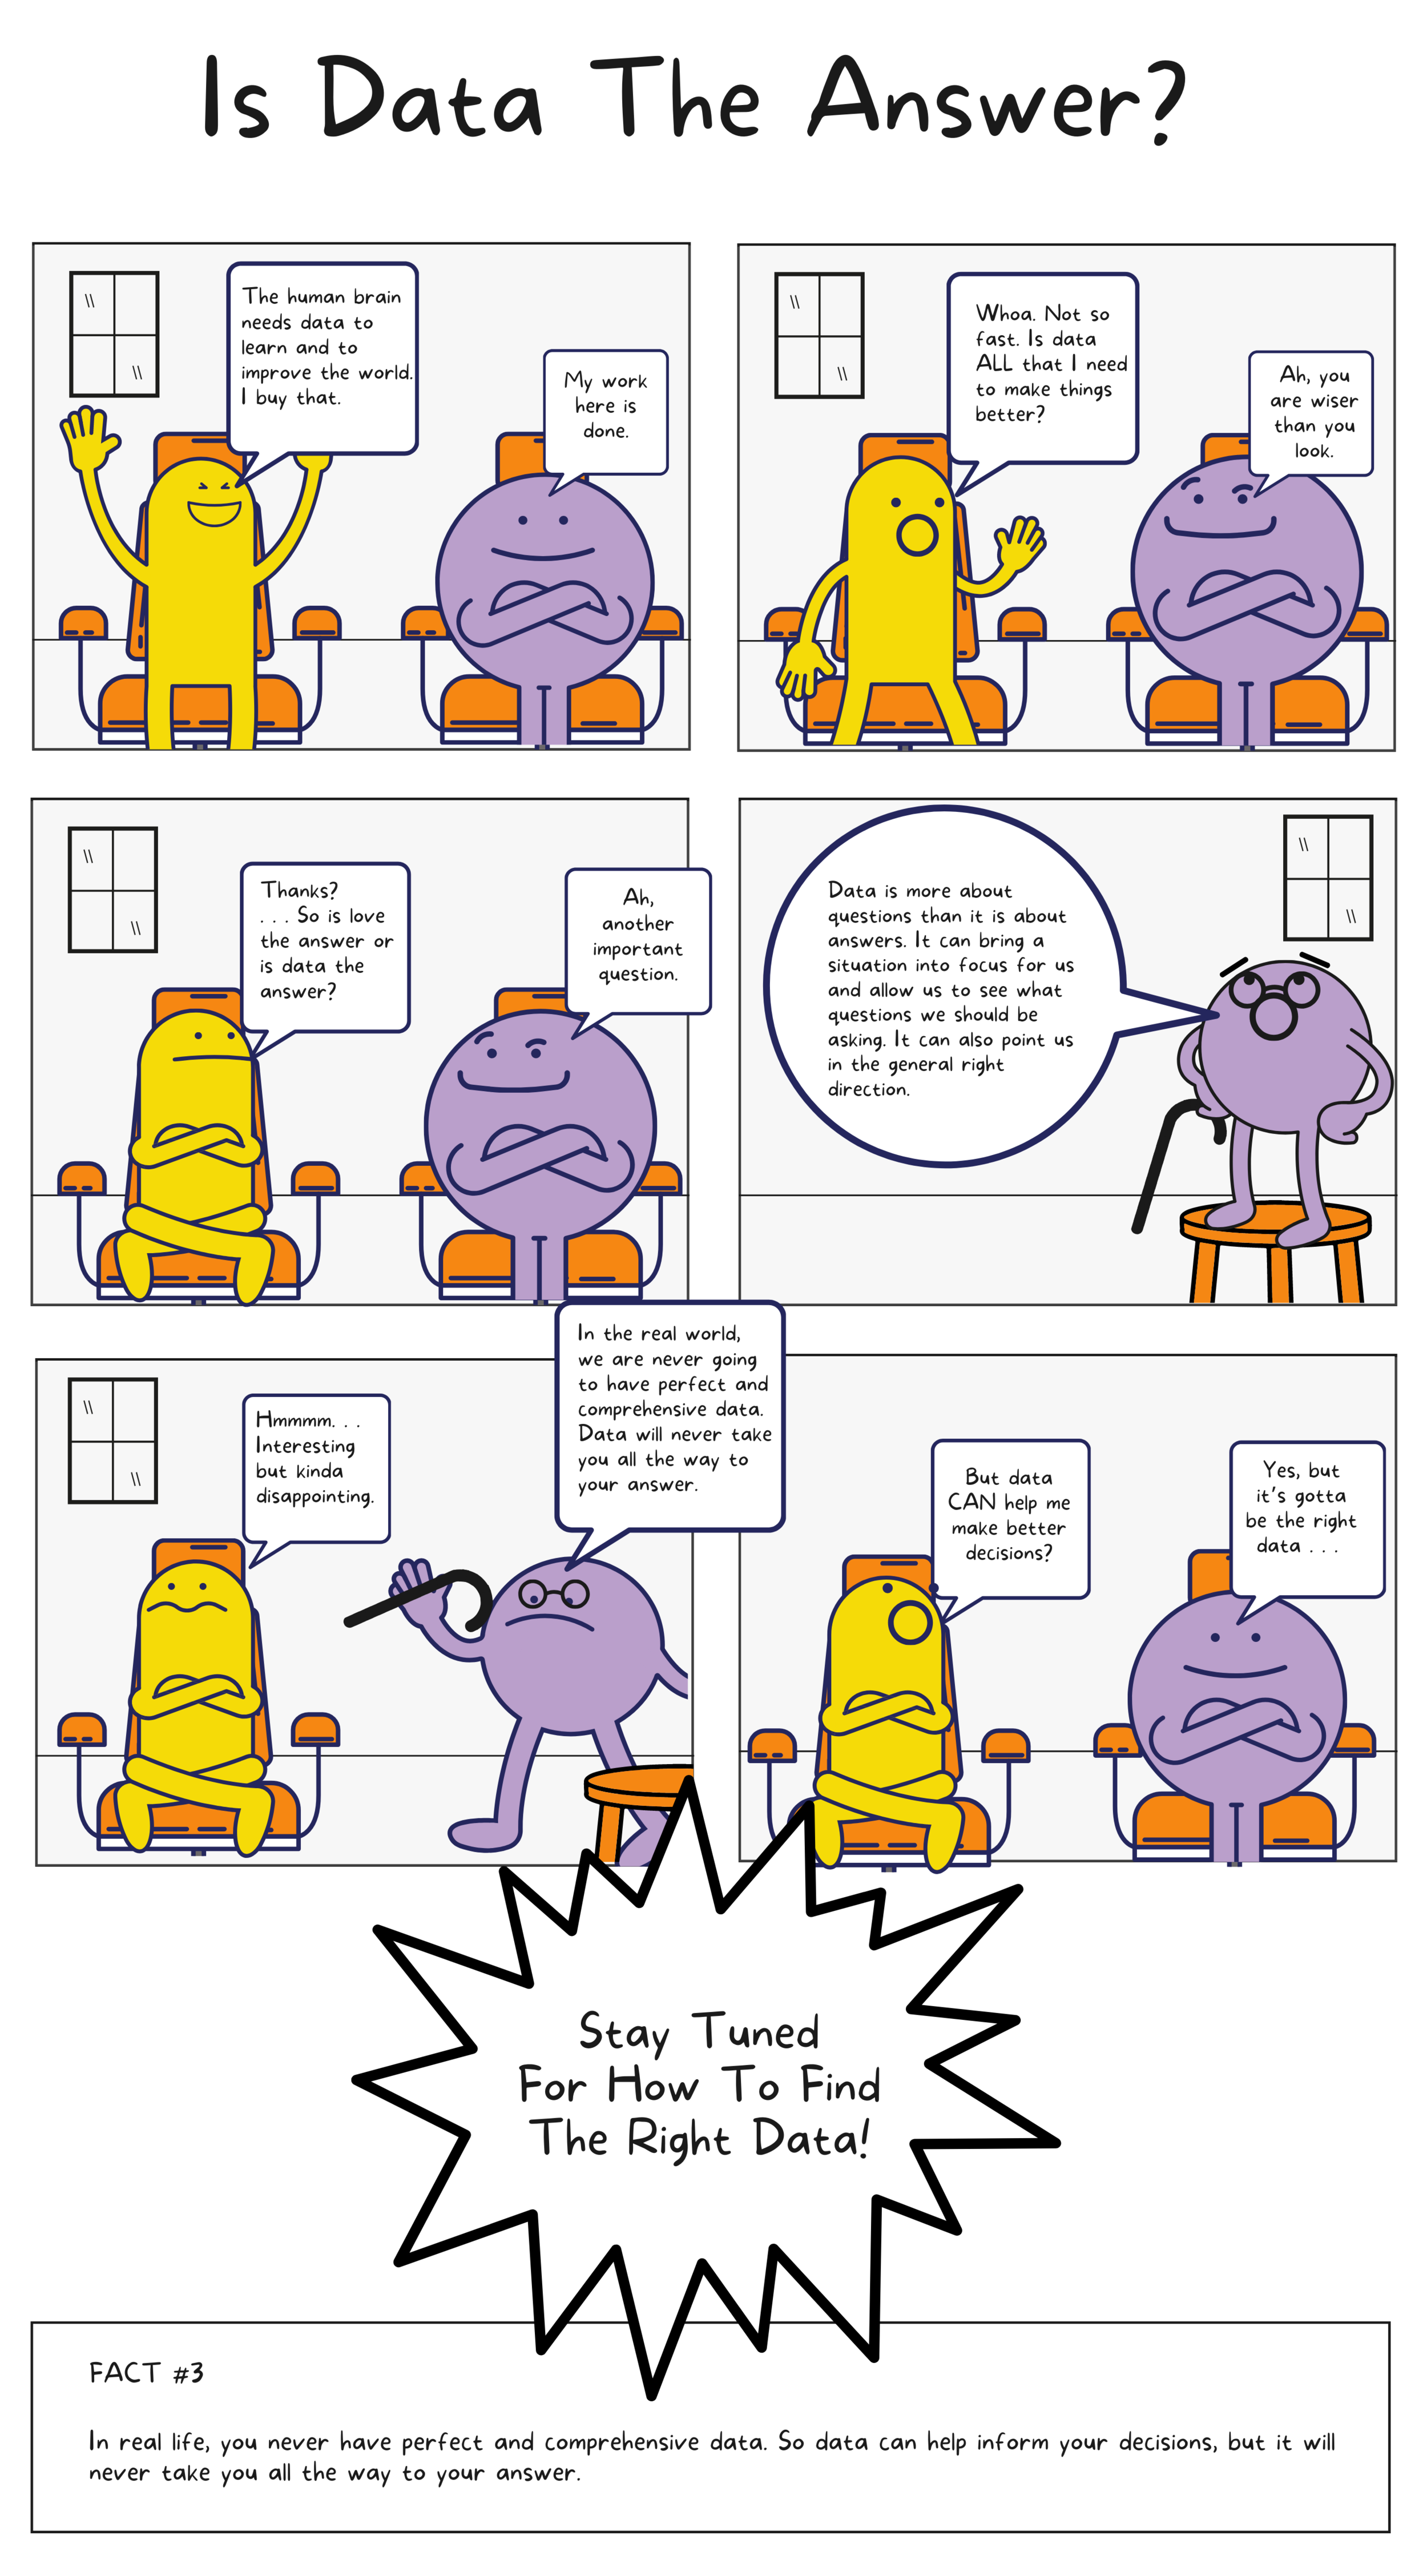
10 Essential Data Facts For Non-Data People (Fact #3)

I’m posting comic strips explaining ten essential data facts for non-data people over time. Check out other data facts which have been posted so far by scrolling down or clicking HERE.


Let’s talk about YOUR data!

Got the feeling that you and your colleagues would use your data more effectively if you could see it better? Data Viz for Nonprofits (DVN) can help you get the ball rolling with an interactive data dashboard and beautiful charts, maps, and graphs for your next presentation, report, proposal, or webpage. Through a short-term consultation, we can help you to clarify the questions you want to answer and goals you want to track. DVN then visualizes your data to address those questions and track those goals.


10 Essential Data Facts For Non-Data People (Fact #2)

I’m posting comic strips explaining ten essential data facts for non-data people over time. Check out other data facts which have been posted so far by scrolling down or clicking HERE.


Let’s talk about YOUR data!

Got the feeling that you and your colleagues would use your data more effectively if you could see it better? Data Viz for Nonprofits (DVN) can help you get the ball rolling with an interactive data dashboard and beautiful charts, maps, and graphs for your next presentation, report, proposal, or webpage. Through a short-term consultation, we can help you to clarify the questions you want to answer and goals you want to track. DVN then visualizes your data to address those questions and track those goals.


10 Essential Data Facts For Non-Data People (Fact #1)

Sources: OECD Glossary of Statistical Terms. OECD. 2008. p. 119. ISBN 978-92-64-025561. and Tuomi, Ilkka (2000). "Data is more than knowledge". Journal of Management Information Systems. 6 (3): 103–117. doi:10.1080/07421222.1999.11518258.

Sources: OECD Glossary of Statistical Terms. OECD. 2008. p. 119. ISBN 978-92-64-025561. and Tuomi, Ilkka (2000). "Data is more than knowledge". Journal of Management Information Systems. 6 (3): 103–117. doi:10.1080/07421222.1999.11518258.

I’m posting comic strips explaining ten essential data facts for non-data people over time. Check out other data facts which have been posted so far by scrolling down or clicking HERE.


Let’s talk about YOUR data!

Got the feeling that you and your colleagues would use your data more effectively if you could see it better? Data Viz for Nonprofits (DVN) can help you get the ball rolling with an interactive data dashboard and beautiful charts, maps, and graphs for your next presentation, report, proposal, or webpage. Through a short-term consultation, we can help you to clarify the questions you want to answer and goals you want to track. DVN then visualizes your data to address those questions and track those goals.