A study by MIT, UC Berkeley, and Tableau researchers found that people prefer charts with clear, helpful text over both plain, bare charts and text-only explanations. But what you write—and where you put it—makes a difference.
What works best:
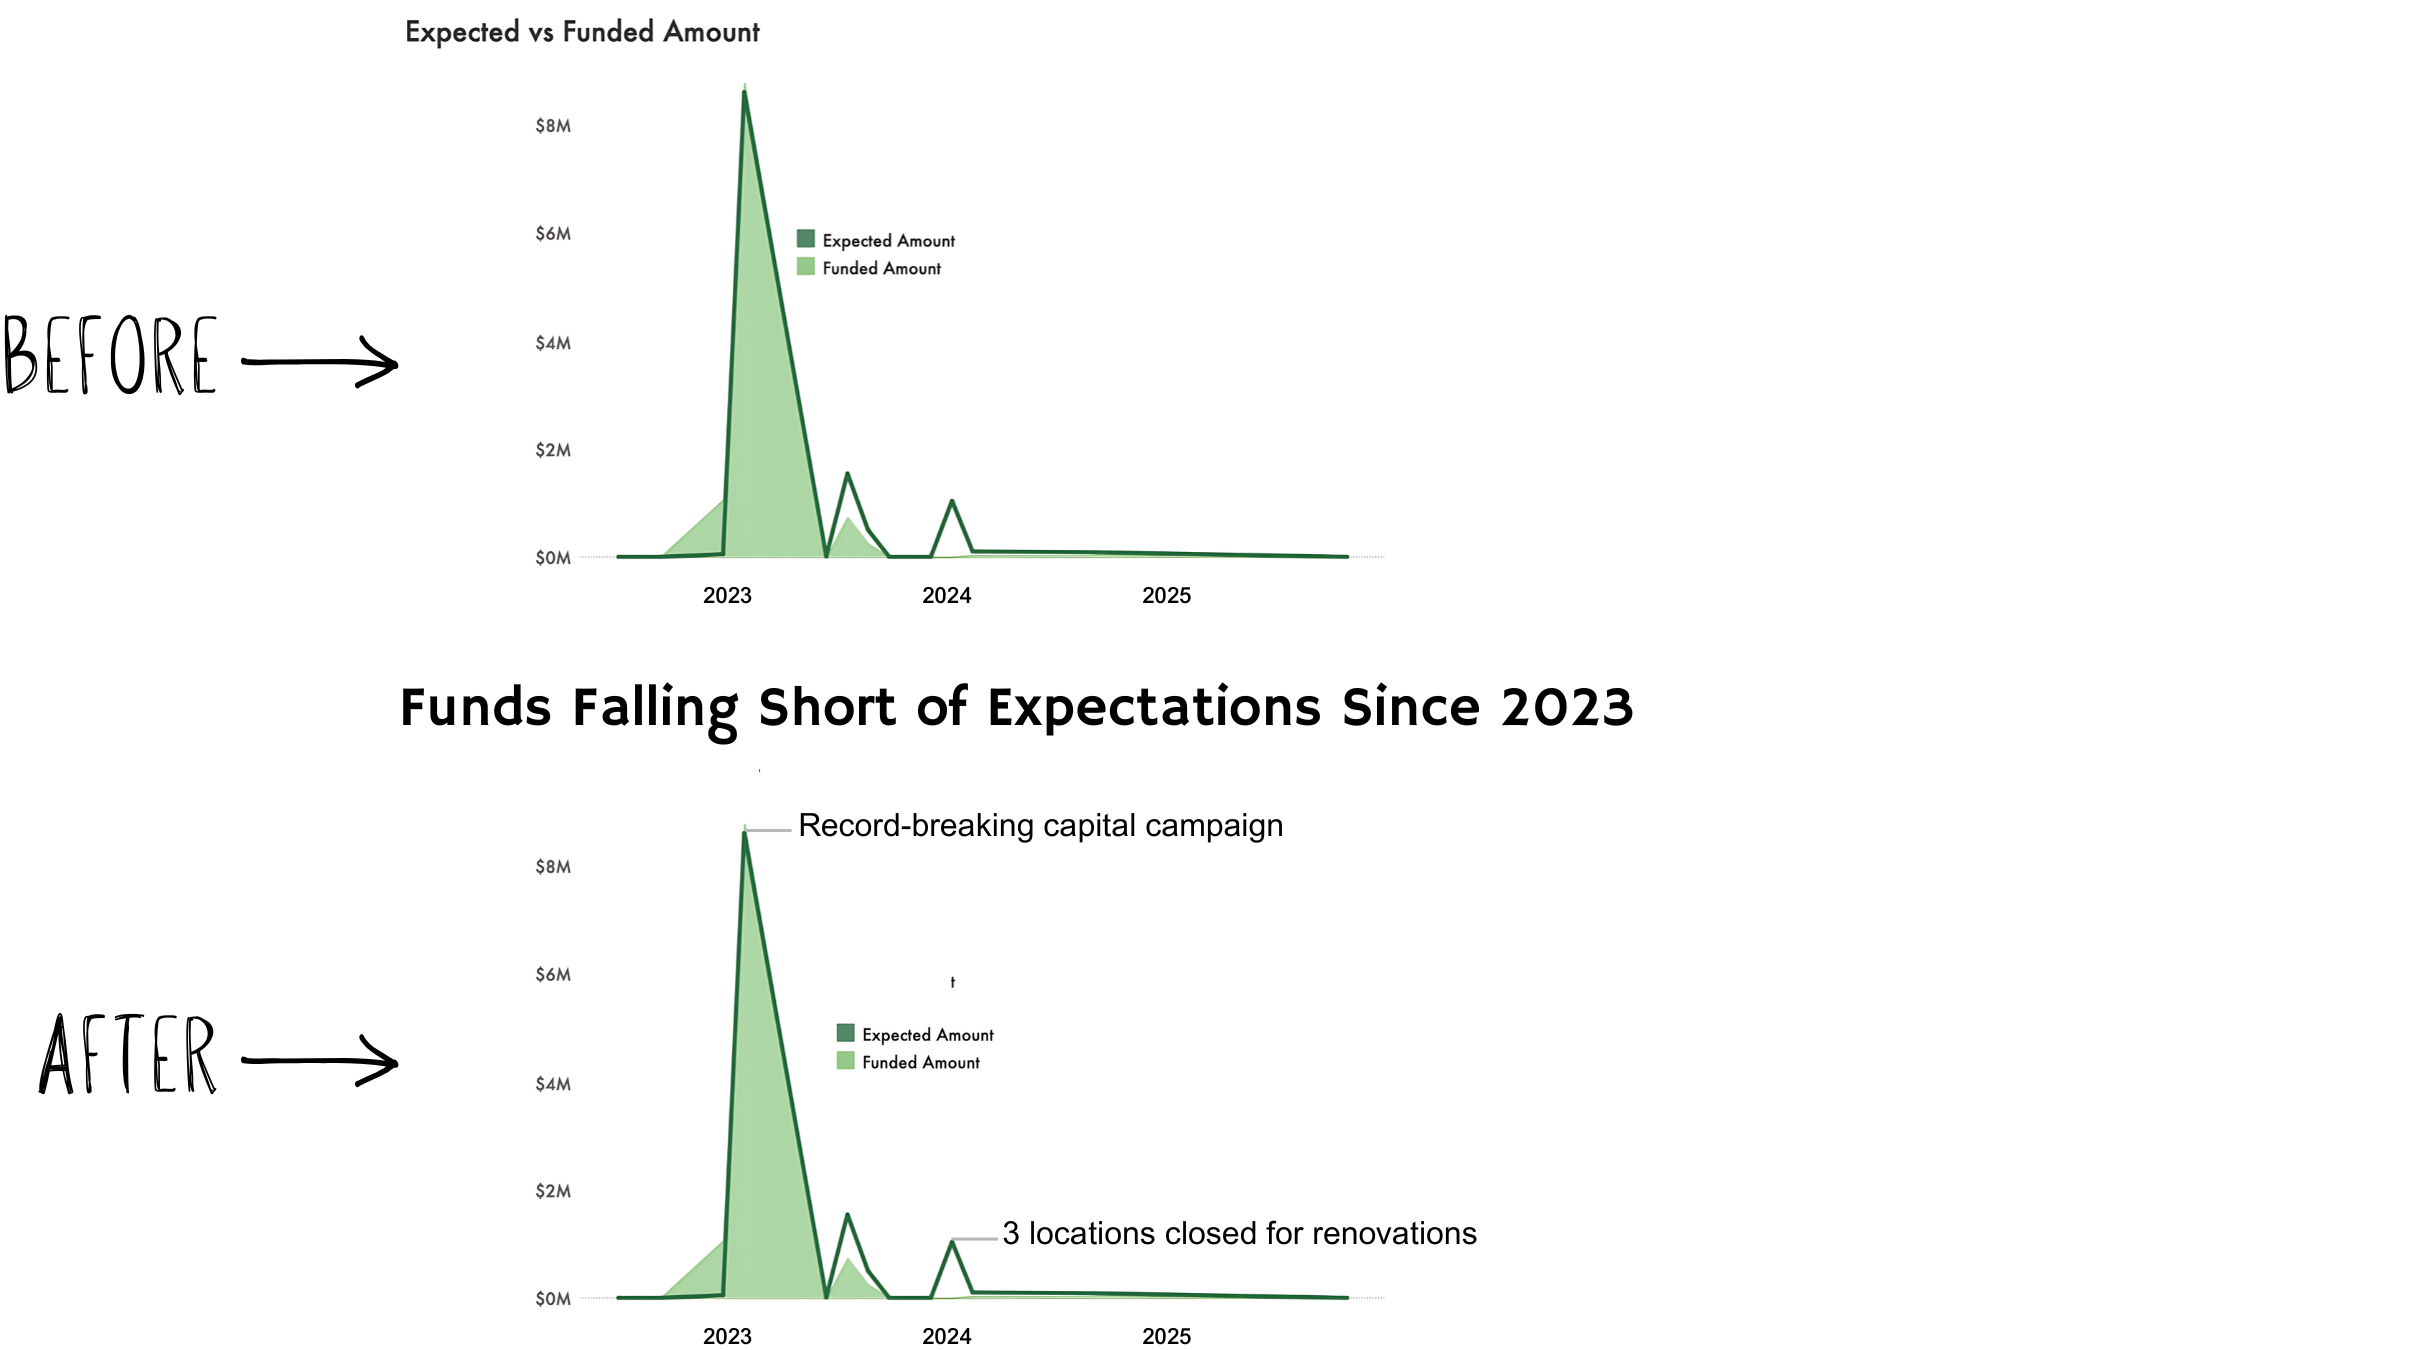
Big picture messages (example: “Sharp drop in donations in 2024”) work well as chart titles—that’s what people notice first and remember best.
Key numbers or comparisons (example: “Highest turnout in 2023”) should go right next to the point or part of the chart they explain.
Context or background info (example: “Policy change led to spike”) also works best close to the related data—not just in the title
Check out how the simple changes made between the before and after charts allow you to more easily draw meaning from it.
Tip for nonprofits: When designing charts for funders, boards, or the public, guide your audience to the key point with well-placed text. They’ll remember your story—not just the numbers.

Let’s talk about YOUR data!
Got the feeling that you and your colleagues would use your data more effectively if you could see it better? Data Viz for Nonprofits (DVN) can help you get the ball rolling with an interactive data dashboard and beautiful charts, maps, and graphs for your next presentation, report, proposal, or webpage. Through a short-term consultation, we can help you to clarify the questions you want to answer and goals you want to track. DVN then visualizes your data to address those questions and track those goals.