
If you want your data to actually influence decisions — not just sit in a report — this spring offers three strong opportunities to level up. Two are workshops I’m leading. One is from the ever-brilliant Ann Emery.
Hosted by Nonprofit Learning Lab, Led by Amelia Kohm
This session focuses on helping nonprofit staff turn analysis into insight. We’ll cover how to clarify your key message, simplify visuals, and structure findings so busy boards, funders, and partners quickly understand what matters — and what to do next.
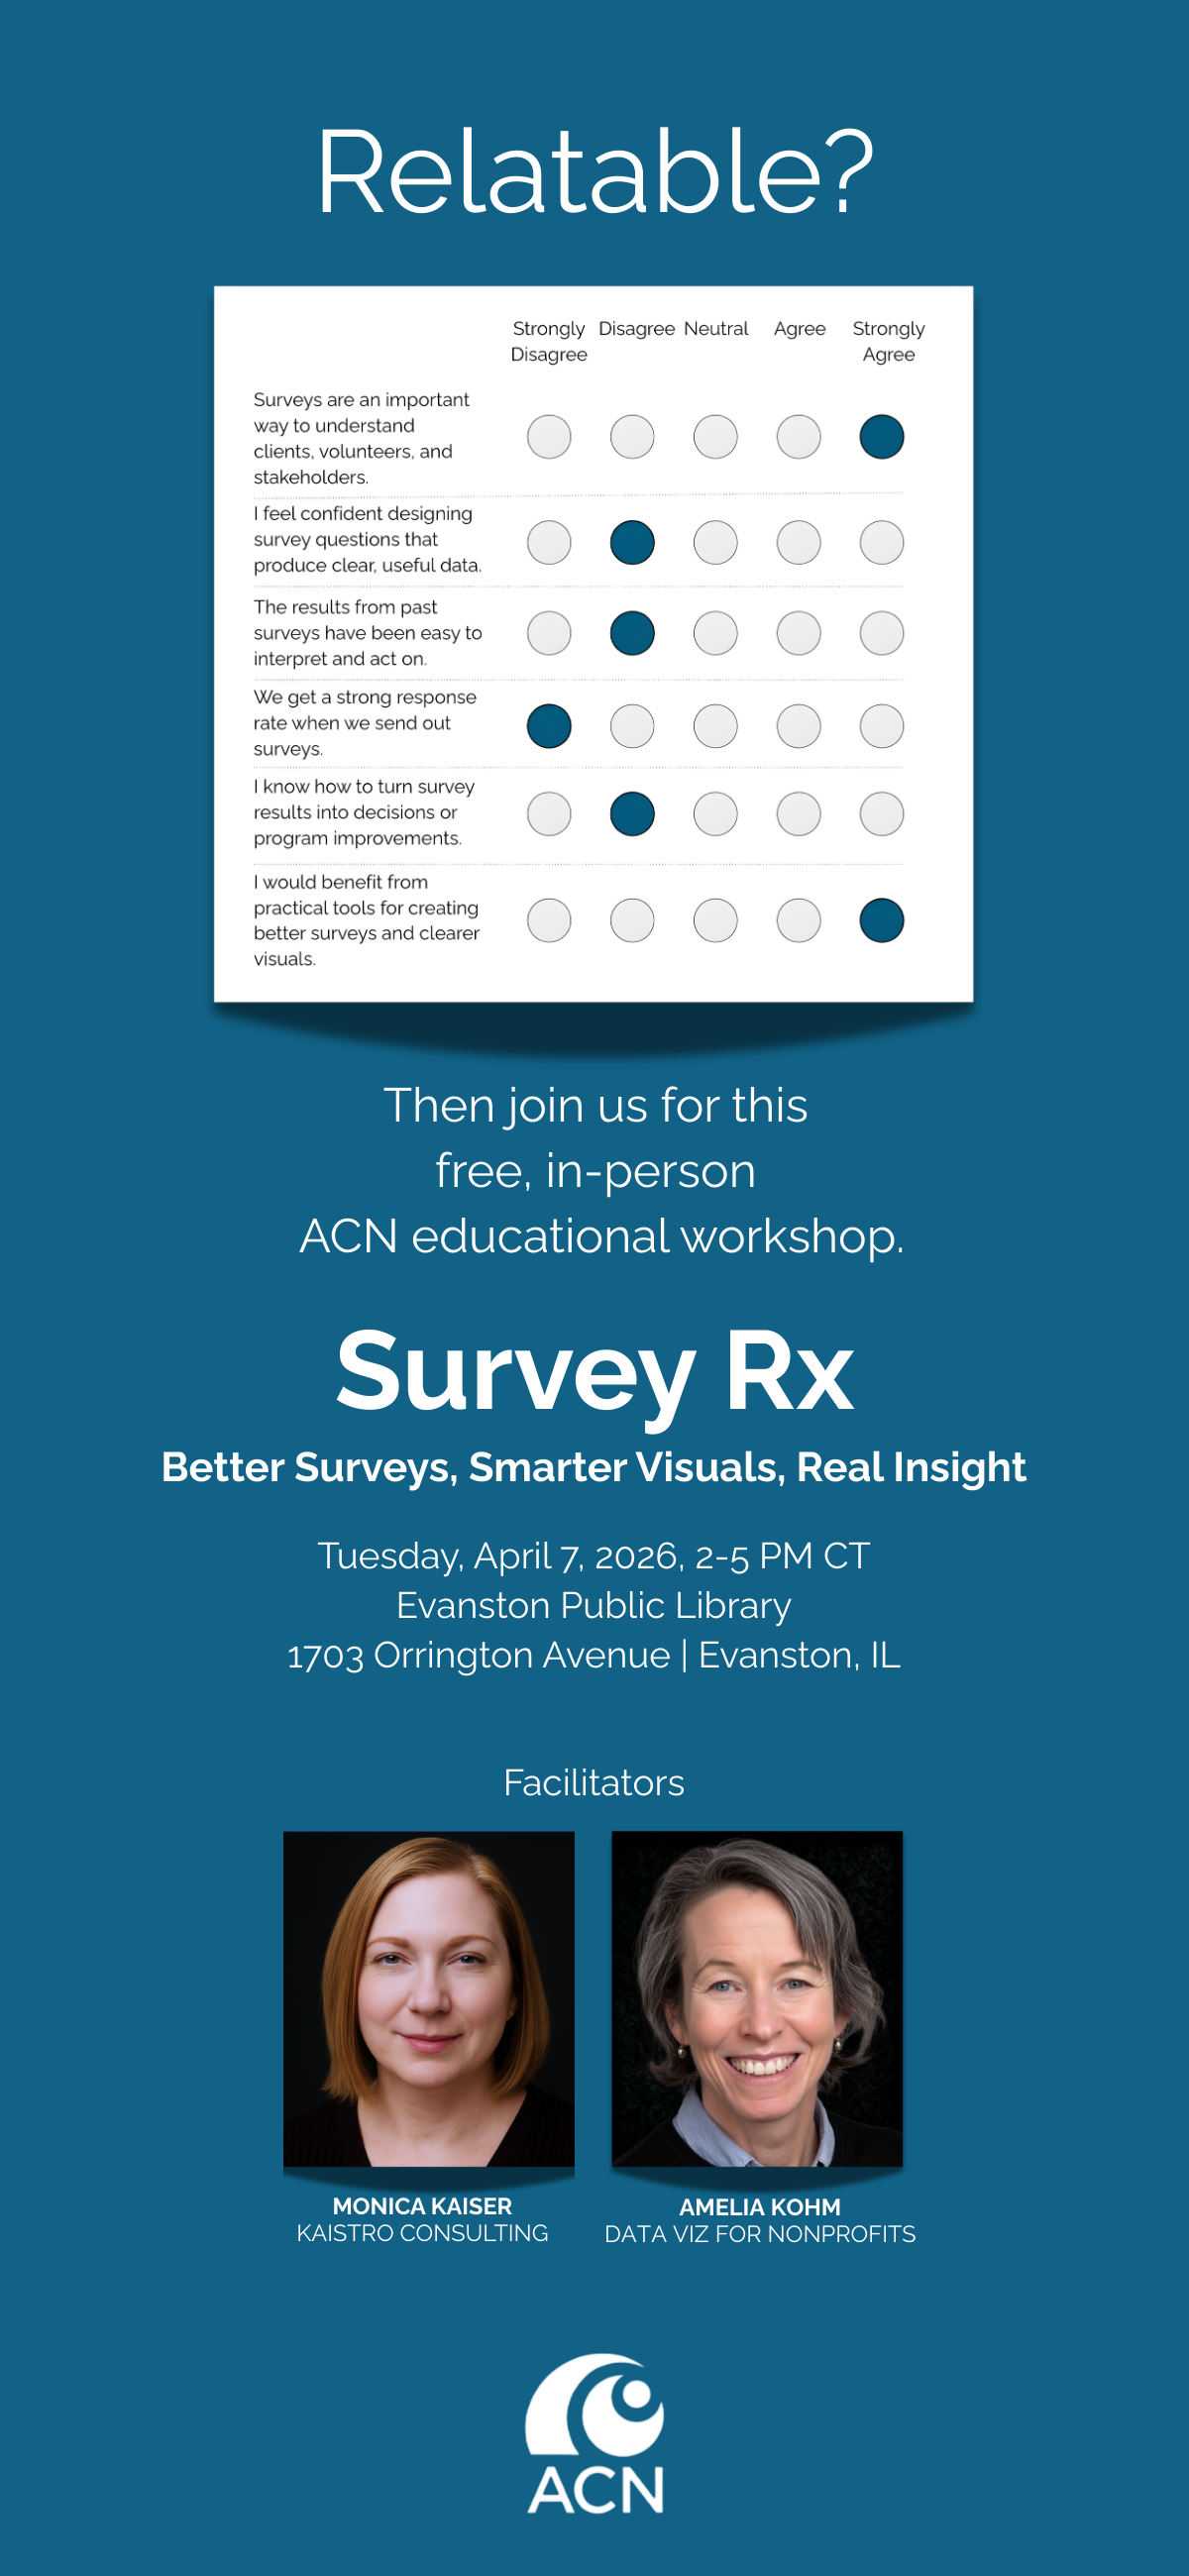
Hosted by Association of Consultants to Nonprofits, Led by Amelia Kohm and Monica Kaiser
This is a live, in-person workshop in the Chicago area. Survey data is everywhere in our sector — and often underused or misinterpreted. Monica and I will cover the full arc:
• Designing surveys that actually produce usable data
•.Writing stronger survey questions
• Understanding response rates and representativeness
• Cleaning and organizing results
• Summarizing quantitative findings clearly
• Synthesizing open-ended comments without overwhelming your audience
• Choosing visuals that make results easier to interpret
If you collect surveys (and who doesn’t?), this session will help you move from raw responses to credible, actionable insight.Whatever it is, the way you tell your story online can make all the difference.
Offered through Depict Data Studio, Led by Ann Emery
Ann is an internationally recognized data visualization expert and founder of Depict Data Studio. Her course focuses on designing presentations that are clear, engaging, and persuasive — so your analysis doesn’t get lost in cluttered slides or dense charts.
Data doesn’t create change on its own. Clear questions. Thoughtful analysis. Engaging presentation. Those skills are learnable — and they’re what help nonprofits turn information into action.

Let’s talk about YOUR data!
Got the feeling that you and your colleagues would use your data more effectively if you could see it better? Data Viz for Nonprofits (DVN) can help you get the ball rolling with an interactive data dashboard and beautiful charts, maps, and graphs for your next presentation, report, proposal, or webpage. Through a short-term consultation, we can help you to clarify the questions you want to answer and goals you want to track. DVN then visualizes your data to address those questions and track those goals.


