

I bring you more chart hacks in Canva!
Canva has a number of simple chart designs that you can adapt to your needs. After starting a design in Canva, click on “Elements” and then type in “chart” in the search window to see the chart options shown in the image to the right. Each allows you to customize the chart by entering in a few data points.
HERE are some ways that I have shared in the past to use other options in Canva to hack out some fun charts. And below, you’ll find a few more ideas.
Chart Hacks
Start a design in Canva by clicking on the “Create A Design” button (upper right corner of screen), selecting a size (such as presentation), and then try one of my hacks.
HACK 1: Place a chart in a landscape: For this bar chart hack, find a landscape by searching in “Elements” (on left side of screen). Landscapes with large, cloudless skies work best. Drag the image onto a page and size it as you like. With the image selected, click on “Edit Image” in the upper left corner of the design area and then use the Background Remover tool to remove the sky. Now create a chart using the chart tools (see above). With the chart selected, click on “Position” in the the upper right corner of the design area and select “Backward” to put the chart sligtly behind the landscape image. (See how the bottoms of the bars in the image below are behind the hills?) Finally, find a sky image by searching in “Background” (on left side of screen) and add it to the design.

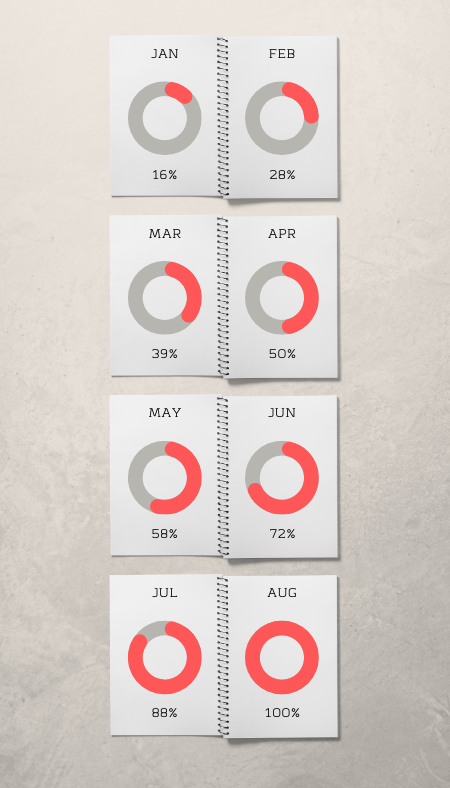
HACK 2: Show change over time in a chart “notebook.” For this chart, I created a series of donut charts using the chart tools (see above). Then I found a notebook graphic in “Elements.” I made several copies of the graphic and added the charts and labels to each page of the notebook.
HACK 3: Use number frames to label a key data point. For this chart, I created a line graph using the chart tools (see above). Then I searched for “number frames” in “Elements.” I added the relevant numbers to label the key data point on the graph and then dragged and dropped photos into the the number frames. Note that you can upload your own photos to Canva or use photos from their vast library of free photos in “Elements.”

HACK 4: Use videos to label a key data point. For something like the chart shown below, create a line graph using the chart tools (see above). Then type in “speech bubble” in the “Elements” search window. Limit the results to only photos by selecting the “Photos” option below the search window. Drag a speech bubble onto the design (and pointing to the key data point) and, with the speech bubble selected, click on “Edit Image” in the upper left corner of the design area and then use the “Shadows” tool to add a shadow to the speech bubble image. Now drag a video to the design and size it to fit inside the speech bubble. Note that you can upload your own videos to Canva or use videos from their vast library in “Elements.”

Let’s talk about YOUR data!
Got the feeling that you and your colleagues would use your data more effectively if you could see it better? Data Viz for Nonprofits (DVN) can help you get the ball rolling with an interactive data dashboard and beautiful charts, maps, and graphs for your next presentation, report, proposal, or webpage. Through a short-term consultation, we can help you to clarify the questions you want to answer and goals you want to track. DVN then visualizes your data to address those questions and track those goals.


