The Pies That Bind

Reposted from November 2022

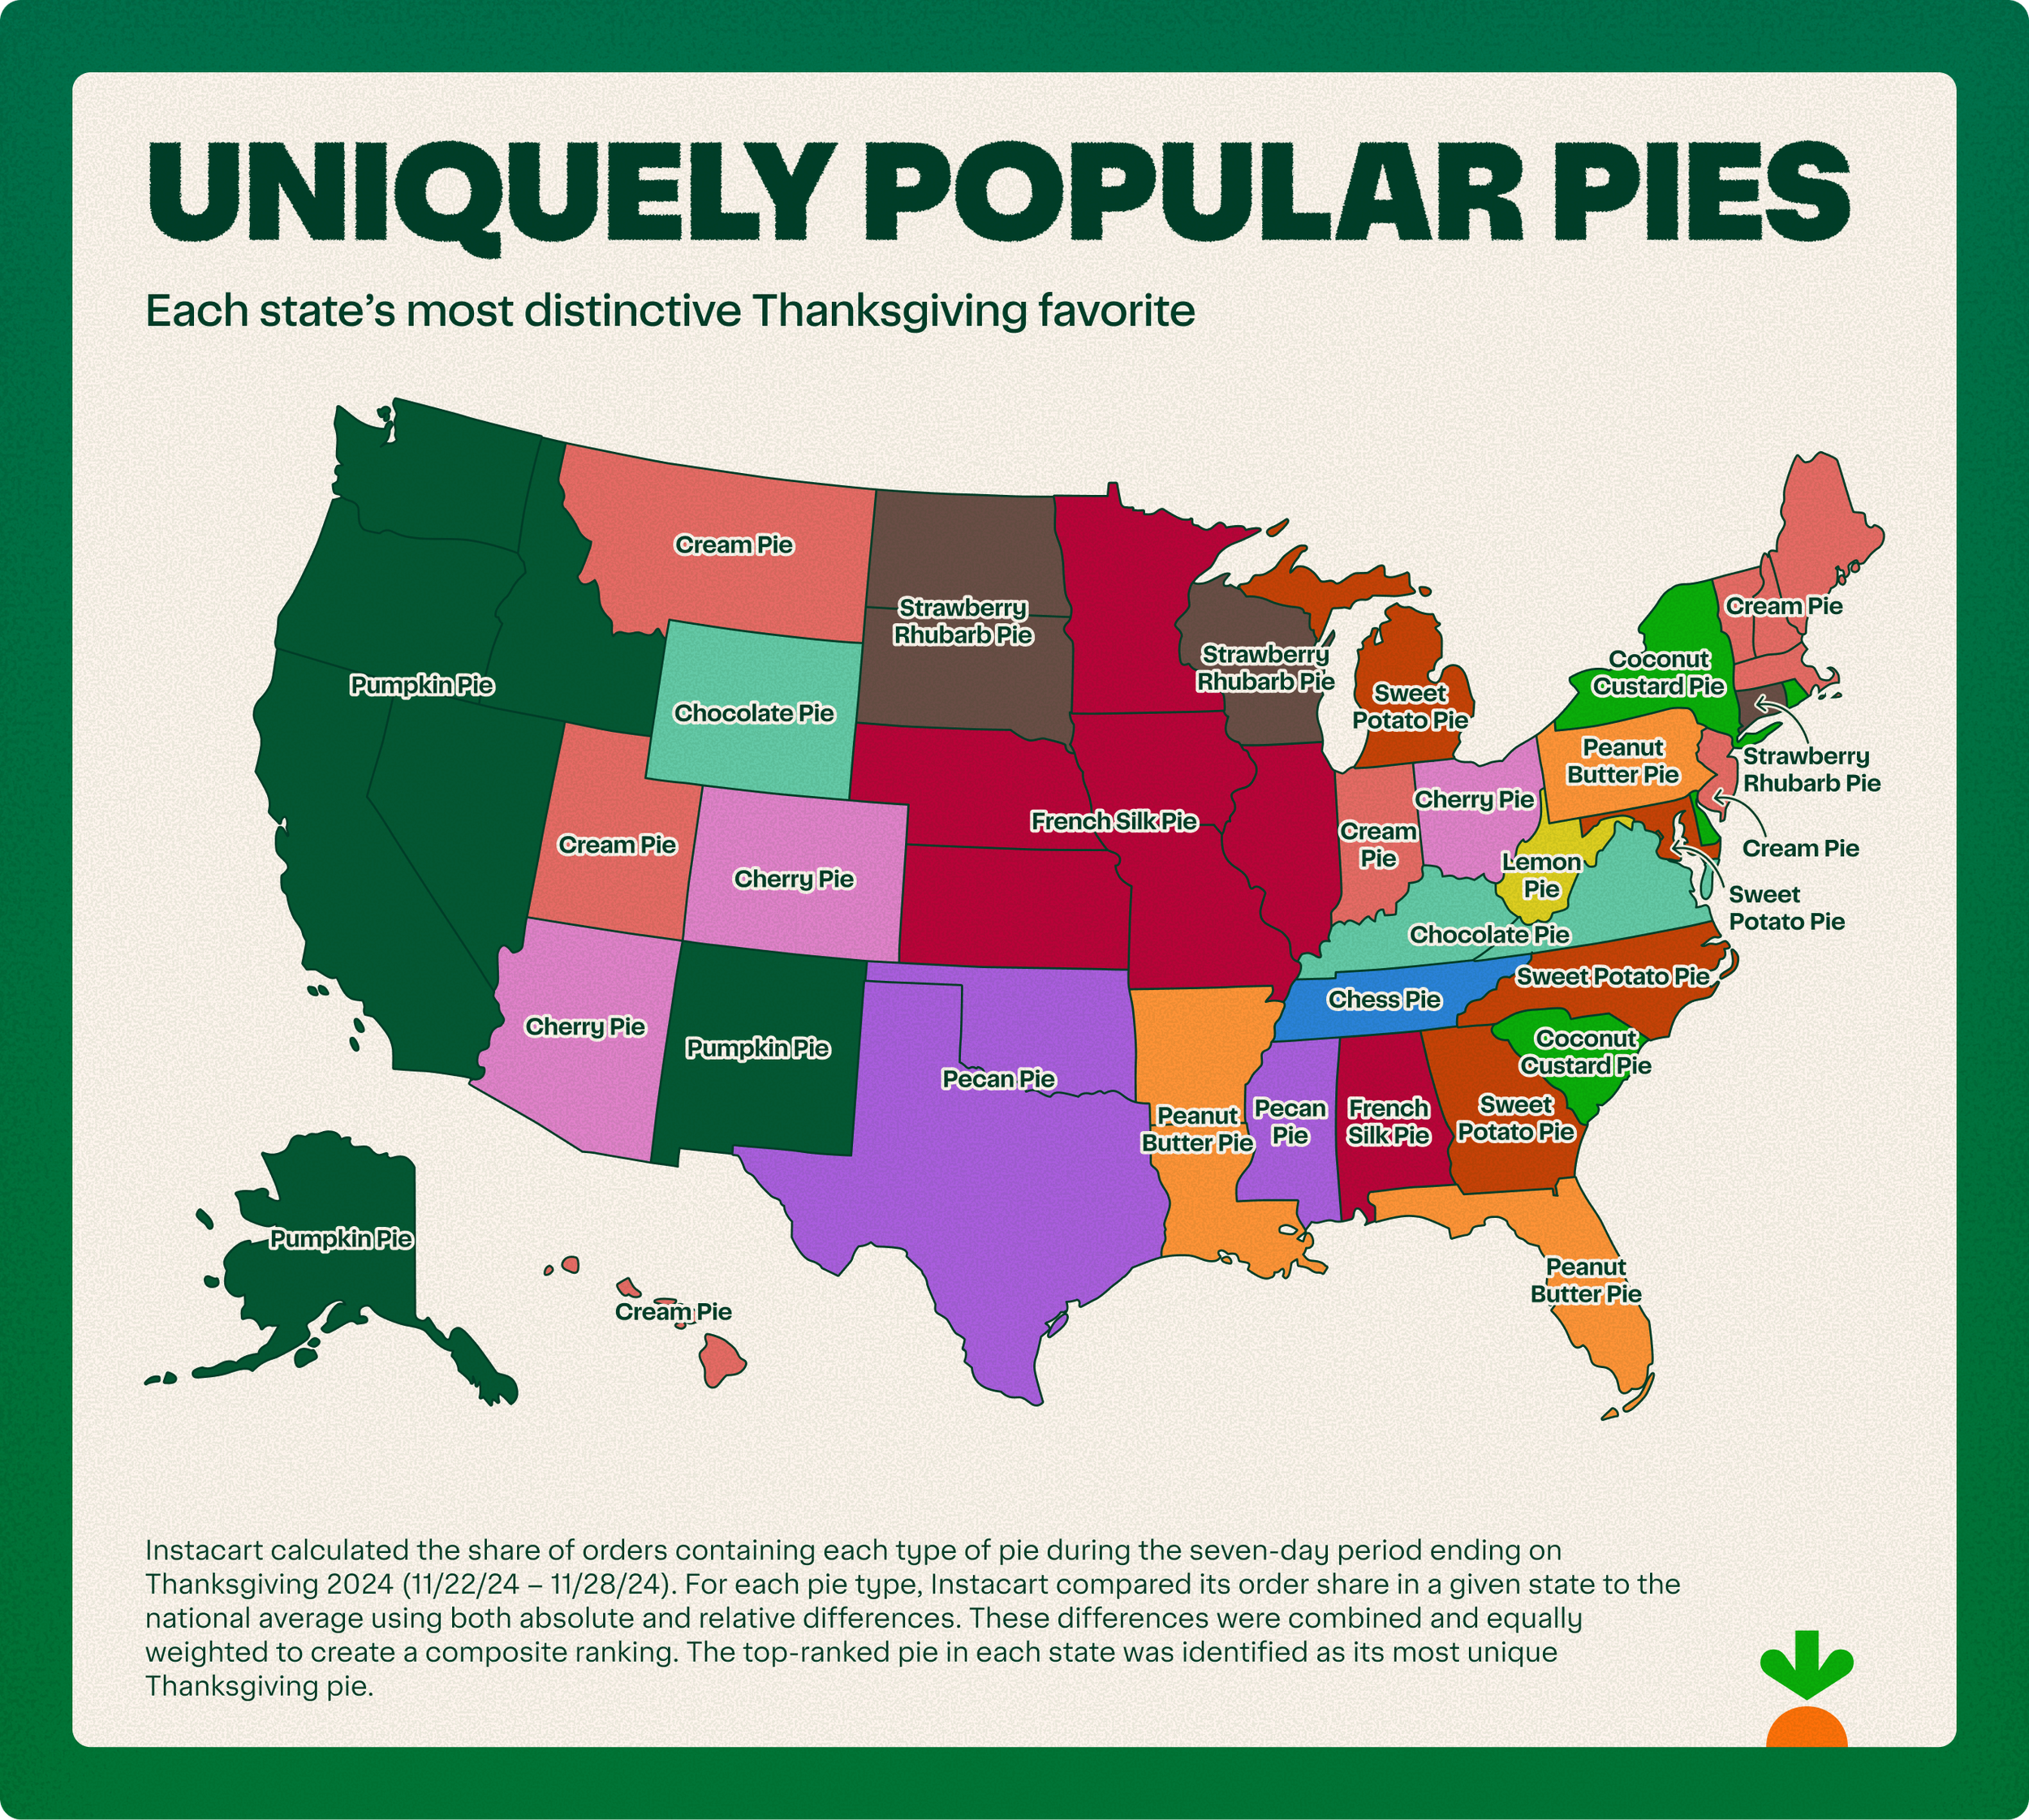
Rather than provide you with a tip, I thought I’d start this holiday week by offering you a little hope instead. It’s pie season, and folks are searching for pie recipes on Pinterest. According to this Food & Wine article, Pinterest analyzed internal search data to discover the most common pie recipe search terms in each state. I took that data and mapped it. As you can see below, pie preferences do not appear to fall along regional, ideological, or even agricultural lines. Minnesotans love lemon pie, and Floridians love pumpkin pie, although I’m guessing that more lemons are grown in Florida and pumpkins in Minnesota. Some states were idiosyncratic in their searches. Hello West Virginians who love no-bake peanut butter pies and Kentuckians who love pies made with cushaws, a type of squash I’d never heard of. But most states shared pie interests with other states. So this Thanksgiving, let’s be thankful for our shared love of pie. Scroll around on the vizes below and Happy Thanksgiving!


Let’s talk about YOUR data!

Got the feeling that you and your colleagues would use your data more effectively if you could see it better? Data Viz for Nonprofits (DVN) can help you get the ball rolling with an interactive data dashboard and beautiful charts, maps, and graphs for your next presentation, report, proposal, or webpage. Through a short-term consultation, we can help you to clarify the questions you want to answer and goals you want to track. DVN then visualizes your data to address those questions and track those goals.

The Pies That Bind

Rather than provide you with a tip, I thought I’d start this holiday week by offering you a little hope instead. It’s pie season, and folks are searching for pie recipes on Pinterest. According to this Food & Wine article, Pinterest analyzed recent internal search data to discover the most common pie recipe search terms in each state. I took that data and mapped it. As you can see below, pie preferences do not appear to fall along regional, ideological, or even agricultural lines. Minnesotans love lemon pies, and Floridians love pumpkin pie, although I’m guessing that more lemons are grown in Florida and pumpkins in Minnesota. Some states were idiosyncratic in their searches. Hello West Virginians who love no-bake peanut butter pies and Kentuckians who love pies made with cushaws, a type of squash I’d never heard of. But most states shared pie interests with other states. So this Thanksgiving, let’s be thankful for our shared love of pie. Scroll around on the vizes below and Happy Thanksgiving!


Let’s talk about YOUR data!

Got the feeling that you and your colleagues would use your data more effectively if you could see it better? Data Viz for Nonprofits (DVN) can help you get the ball rolling with an interactive data dashboard and beautiful charts, maps, and graphs for your next presentation, report, proposal, or webpage. Through a short-term consultation, we can help you to clarify the questions you want to answer and goals you want to track. DVN then visualizes your data to address those questions and track those goals.