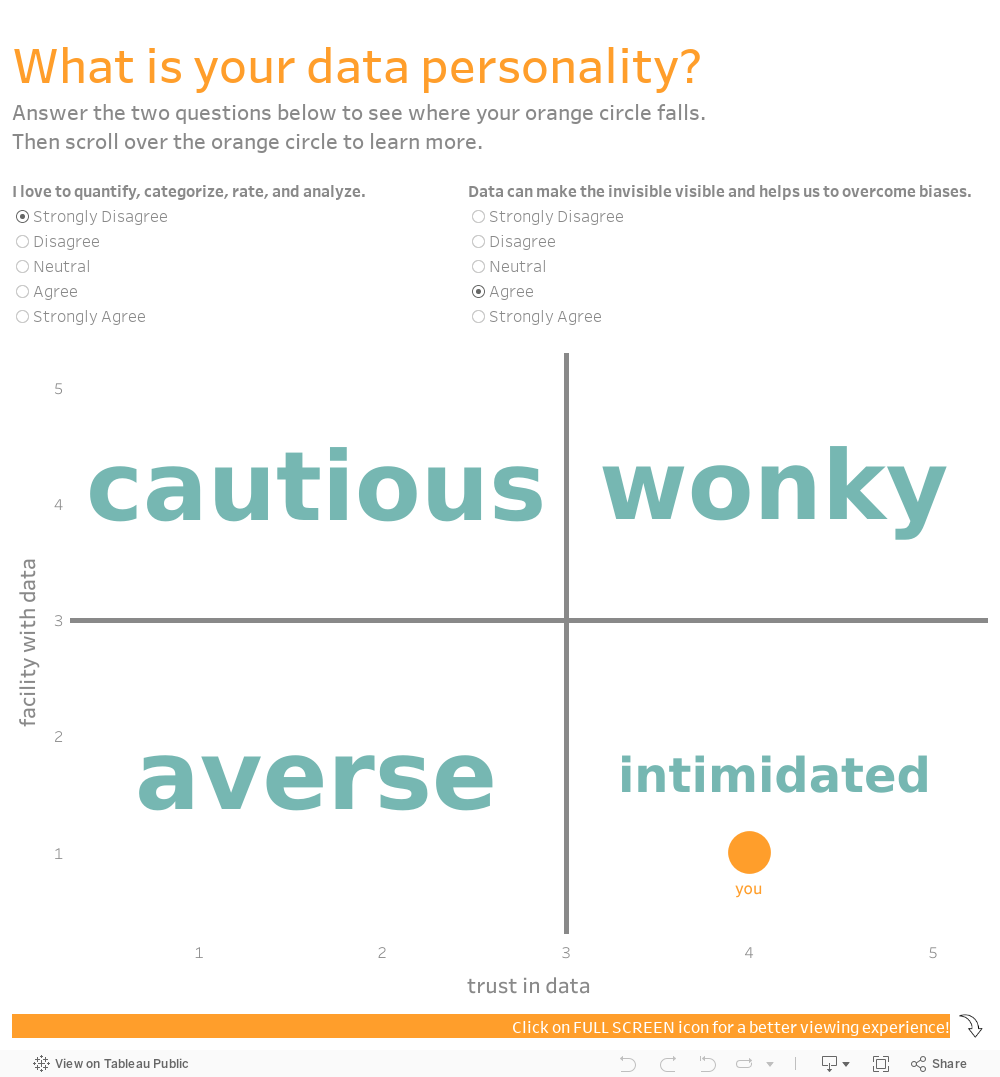
It's Love Data Week!

What’s that?

Love Data Week is an international celebration of data, taking place every year during the week of Valentine's Day. Nonprofit organizations, universities, government agencies, corporations and individuals are encouraged to host and participate in data-related events and activities.

What’s in it for me?

Lots of free online events, many of which are relevant to nonprofit work such as workshops on data visualization, infographics, data resources, data privacy, etc. See a full list of events HERE.

Where can I learn more?

HERE.

To see past data tips, click HERE.


Let’s talk about YOUR data!

Got the feeling that you and your colleagues would use your data more effectively if you could see it better? Data Viz for Nonprofits (DVN) can help you get the ball rolling with an interactive data dashboard and beautiful charts, maps, and graphs for your next presentation, report, proposal, or webpage. Through a short-term consultation, we can help you to clarify the questions you want to answer and goals you want to track. DVN then visualizes your data to address those questions and track those goals.


It's Love Data Week!

What’s that?

Love Data Week is an international celebration of data, taking place every year during the week of Valentine's Day. Nonprofit organizations, universities, government agencies, corporations and individuals are encouraged to host and participate in data-related events and activities.

What’s in it for me?

Lots of free online events, many of which are relevant to nonprofit work such as workshops on data visualization, infographics, open (i.e. free) data, data privacy, etc. See a full list of events HERE.

Where can I learn more?

HERE.

To see past data tips, click HERE.


Let’s talk about YOUR data!

Got the feeling that you and your colleagues would use your data more effectively if you could see it better? Data Viz for Nonprofits (DVN) can help you get the ball rolling with an interactive data dashboard and beautiful charts, maps, and graphs for your next presentation, report, proposal, or webpage. Through a short-term consultation, we can help you to clarify the questions you want to answer and goals you want to track. DVN then visualizes your data to address those questions and track those goals.


Sure Data Confuses You. You Are An Early Human.

I recently read this article which suggests that, if we avoid a large catastrophe, we may be living at the early beginnings of human history. That is sort of mind-boggling. But even if we are not early humans, we are certainly at the beginning of our journey with data.

We aren’t so good at processing words and numbers and making sense of them. Think about the last time you looked at a spreadsheet and got the gist of it in a few seconds. By contrast, we can all get the gist of a photo in less than a few seconds. That’s because our brains have evolved over millions of years to process visual information — color, shape, size, placement — at lightening speed. Indeed, our survival depended on it. Think about detecting predators in the tall grass at a distance.

Processing words and numbers is a quite recent activity for humans, as the timeline below shows. Perhaps, as our brains evolve, we will be able to discern a spreadsheet at a glance. But, until then, we should consider visualizing our data by translating words and numbers into color, shape, size, and placement in the form of charts, maps, and graphs.

To see past data tips, click HERE.


Let’s talk about YOUR data!

Got the feeling that you and your colleagues would use your data more effectively if you could see it better? Data Viz for Nonprofits (DVN) can help you get the ball rolling with an interactive data dashboard and beautiful charts, maps, and graphs for your next presentation, report, proposal, or webpage. Through a short-term consultation, we can help you to clarify the questions you want to answer and goals you want to track. DVN then visualizes your data to address those questions and track those goals.


Why Nonprofits Can Ditch Statistics

60-SECOND DATA TIP_4.gif

Today’s tip is to check out Maryfrances Porter and Alison Nagel’s excellent article Why Nonprofits Shouldn’t Use Statistics on the Depict Studio Blog. Here is a 60-second version with my two cents.

I agree with Porter and Nagel that you probably should not be worrying about statistics due to :

  1. Small numbers. Most nonprofit organizations are not serving thousands or millions, but rather tens and hundreds. It’s hard to draw scientifically defensible conclusions based on small numbers. Any individual in a small group has an outsized impact on the group as a whole.

  2. No reasonable comparison group. To make a scientifically defensible claim about the impact of your program, you usually need to compare your participants to a random group of people who do not participate in the program. And, as Porter and Nagel note, “we’ve never met a nonprofit so flush that they had money to track people they don’t serve.”

So how should nonprofits use all that data that they collect everyday? Porter and Nagel suggests that organizations:

  1. Look for pattens, themes and trends. When considering data on participation, feedback from surveys and focus groups, and other data you may collect, look for themes and patterns. Then consider how those themes and patterns change over time and how they differ among subgroups. The best way to see patterns, themes, and trends is in the form of charts, maps, and graphs.

  2. Consider possible causes. Based on your experience, what might be the reasons behind the patterns, themes, and trends you see? Consideration of this question with your colleagues can lead to valuable hypotheses. You can use these hypotheses to make program changes and see if the data you subsequently collect suggest that those changes led to more positive outcomes. You are not demonstrating impact in a scientific way, but you are using data to inform your decisions.

I don’t agree with Porter and Nagel that you have to know what graphs you want before creating them in Tableau. Actually, I think Tableau provides a more nimble way of exploring your data in different visual formats than you can in Excel. But use whatever tool you are comfortable with. Or hire someone (like Data Viz for Nonprofits) to visualize your data for you. An interactive dashboard makes it easy to track your progress on a regular basis.

To see past data tips, including lots of tips on ways to visualize nonprofit data, click HERE.


Let’s talk about YOUR data!

Got the feeling that you and your colleagues would use your data more effectively if you could see it better? Data Viz for Nonprofits (DVN) can help you get the ball rolling with an interactive data dashboard and beautiful charts, maps, and graphs for your next presentation, report, proposal, or webpage. Through a short-term consultation, we can help you to clarify the questions you want to answer and goals you want to track. DVN then visualizes your data to address those questions and track those goals.


What's Your Data Personality?

Re-posted from July 2019

Re-posted from July 2019

Some of us might be resistant to data but who can resist an over-simplistic personality quiz? I’ve developed a tool to determine your data personality. Just answer two questions and BOOM you fall into (or on the border of) one of four personality types. But wait! That’s not all. You also get a “data prescription” tailored to your personality type.

Sure, the tool is highly unscientific. But it’s fun and throws some light on how we can help ourselves and those with other data personalities (living in the next cubicle, board room, or across the world wide web) to better understand and use data.

What are the four data personality types? Well, there’s . . .

The Wonky

These are the unabashed number lovers with a deep belief that, with enough data, we can make much better decisions. They yearn for equations and algorithms. They find meaning in all those Greek statistical symbols that baffle the rest of us. Data Prescription: Feed the Wonky a steady and ample diet of data in almost any form. But also help them to communicate data to the not-so-wonky through charts, maps, and graphs so that the message behind the data is as clear to others as it is to them.

The Intimidated

The intimidated long for the objectivity that data and the scientific method offer. They want something besides their gut or conventional wisdom as a compass. But they glaze over at the sight of a spreadsheet and worry that they cannot confidently assess the quality or implications of their data. Data Prescription: Relax the Intimidated with well-designed charts, maps, and graphs.

The Cautious

These folks are comfortable with numbers. They took stats in high school or college and aced it. But they worry about the accuracy of data, particularly data they did not collect themselves. Data Prescription: Like the Intimidated, the Cautious do well with charts, maps, and graphs but also need assurances regarding data sources. While you should be upfront about the sources and limitations of your data with all data personality types, provide more detailed information to the Cautious.

The Averse

In the Averse, we find the perfect storm: both a distaste for and a distrust of data. Data Prescription: They need to be eased along in their engagement with data. Try starting with data that’s familiar to them. And what’s more familiar and fascinating than data about ourselves? So try putting-the-viewer-in-the-viz. Show The Averse how their height, salary, diet, or opinions compare to that of others. Ask them to guess a statistic before showing them the answer. (For a great example of this, see this article in the Guardian.) As you move them into more complex data, make your charts as simple and user-friendly as possible. This often includes sign posts directing them through the viz.

Yes, visualized data (in the form of charts, maps, and graphs) are prescribed for all data personality types. They either clarify data for you or for others who need to understand it. Data viz is no cure-all but it often helps, particularly in nonprofits which are often staffed by the Intimidated and the Averse.

I hope this personality quiz — like so many overly-simplistic quizes — makes you feel less alone and gets you thinking about upping your data game.

For many tips on why and how to visualize data, take a stroll through past 60-Second Data Tips.


What Data Do You Absorb (And What Eludes You)?

60-SECOND DATA TIP #8.png

There is a certain breed of nonprofit staff who roll their eyes at the mention of “evidence-based practices” or “KPIs” or other data jargon. I myself have experienced mild nausea when listening to someone try to quantify what seems unquantifiable: what a child feels after learning to paint or what a homeless adult feels upon acquiring an apartment.

But I’m here to implore, beseech, even beg you to not write off data. Why? Because of how our brains work.

What we perceive is based not just on what we actually observe but also on what we expect to observe. This is how it works. First, the brain evaluates which of a variety of probable events are actually occurring. Then it uses this information, along with signals from the outside world (aka data), to decide what it is perceiving.  And here's the surprising news: there are far more signals coming from within the brain that affect our perception than data signals from the outside.

These inner brain signals or expectations can distort our understanding of a situation. Thus data are quite important to confirming or negating our expectations.  But you have to pay attention to data to make that happen. And that’s where things get tricky.

The esteemed philosopher and psychologist, William James, noted in The Principles of Psychology (1890): “Millions of items of the outward order are present to my senses which never properly enter into my experience. Why? Because they have no interest for me. My experience is what I agree to attend to. Only those items which I notice shape my mind .” 

So how can we see what we are not attending to, the stuff that eludes us? The answer is to think like a scientist. Rather than operating on assumption or instinct, form hypotheses about how your programs and services work and then gather data to test them. You might be surprised.

(And, if you missed it, check out last week's data tip on how data visualization can help correct misperceptions.)

See other data tips in this series for more information on how to effectively visualize and make good use of your organization's data.

How to Make Your Data Irresistible (To Your Donors, Board Members, and Everyone Else)

60-SECOND DATA TIP #8 (1).png

We humans might be data averse by nature – especially when presented with data in a spreadsheet (see Data Tip #1). But there is one type of data we can’t get enough of: data about ourselves. So when visualizing data, consider how you can put your viewer/user/reader into the chart, graph, or map.

The Guardian cleverly places their reader squarely in the middle of this simple chart. First, they ask what the reader expects is the correct answer to a question concerning a news topic such as: “Out of every 100 prisoners in the United States, about how many do you think were born in a foreign country?” The reader gives her answer and then can compare her answer to that other others in her country and to the correct answer. 

Try it yourself. Would these stats have engaged you nearly as much had The Guardian simply presented them in text form? Are you more likely to remember these stats tomorrow? Did you reflect on how on/off the mark you were? Did you consider why your answer differed from that of others?

See other data tips in this series for more information on how to effectively visualize and make good use of your organization's data.

Photo by Ashim D’Silva on Unsplash

Admit That You Avoid Data

tip2.jpg

Nonprofits avoid data for any number of understandable reasons, including:

Data animus. Many nonprofit staff members possess expertise in environmental issues, the arts, health, or education but not data analysis. Some suffer from data aversion. They admit — or sometimes proudly proclaim — that they are not “numbers people.”

Time. Nonprofit staffers do not have time for data analysis. They are struggling to stay afloat, to submit the next proposal, to sustain their programs, to address the huge and varied needs of their clientele, to cultivate donors. As a result, digging through data is almost always a back-burner item.

Fear. Some worry about what their data might reveal. They fear they won’t be able to control the narrative, that the data will be taken out of context, or that funders will withdraw their support based on the data.

“Dirty” data. Many nonprofits have entry-level staff or multiple staff entering data into management information systems or spreadsheets. The result can be “dirty” data — data with a troubling level of inaccuracy because it has not been entered correctly and/or consistently.

Wrong data. While many nonprofits have data on their financials and clients, they often lack data that demonstrates theimpact of their programs. A tutoring program may not track students’ school grades or test scores. An employment program may lack data on program graduates’ wages over time.

Disconnected data. Rather than maintaining a central management information system, small nonprofits often store their data in separate Excel spreadsheets.

See other data tips in this series for how to overcome barriers to data use.

Image Source: smejoinup.com

(This data tip originally appeared on Philanthropy News Digest’s PHILANTOPIC blog.)