
I rarely find clustered bar charts to be enlightening. Take this one I recently came across in an article about Chicago’s Auburn Gresham neighborhood. Take about 5 seconds and see what you extract from it. Then scroll down.
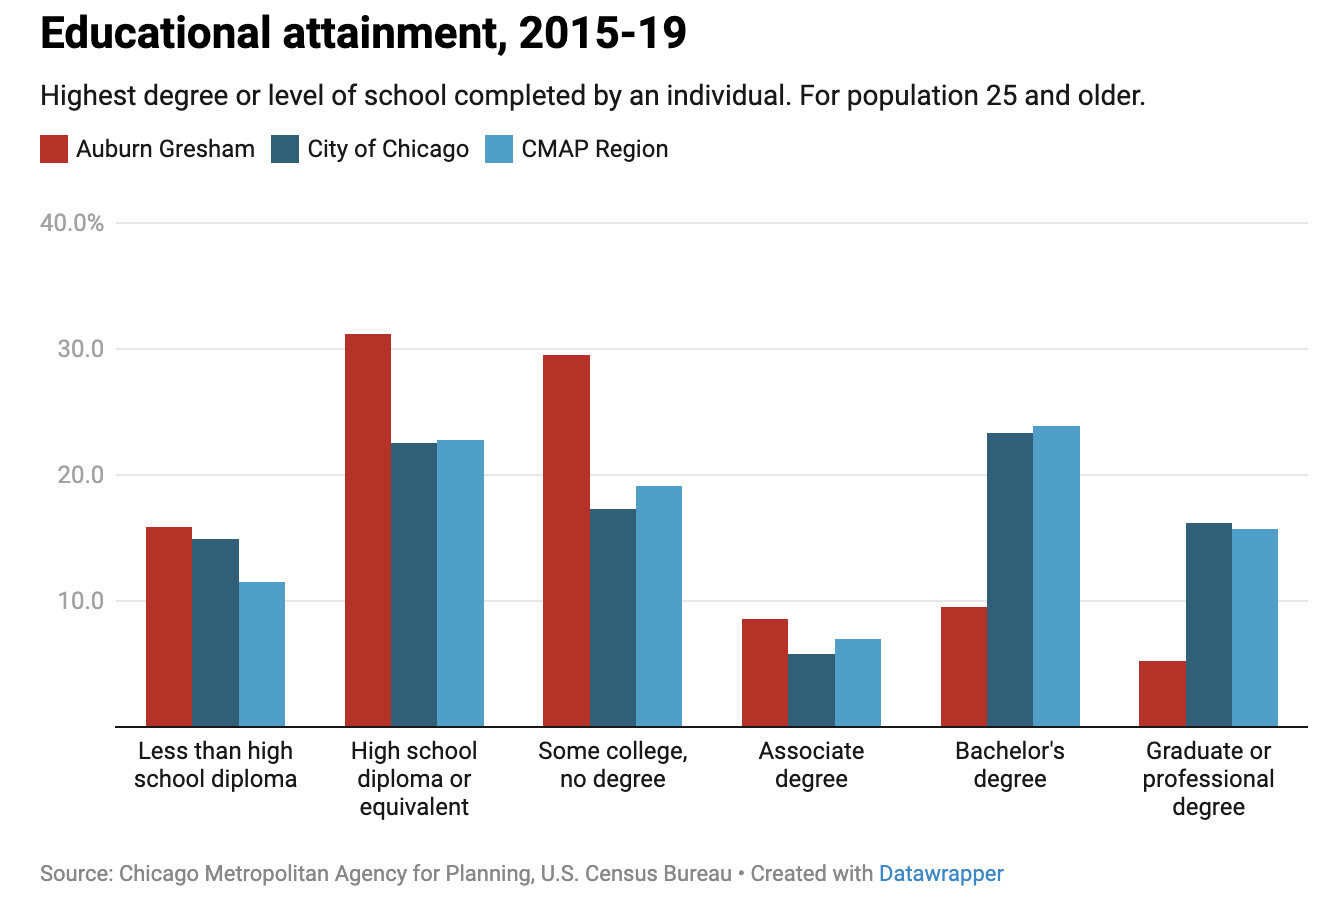
Source: Crain’s Chicago Business
My guess is that you didn’t extract much. By the time you’ve read the title and figured out which colors relate to which geographic areas, your 5 seconds are up. Below is my makeover. Take another 5 seconds to review it and then scroll down.
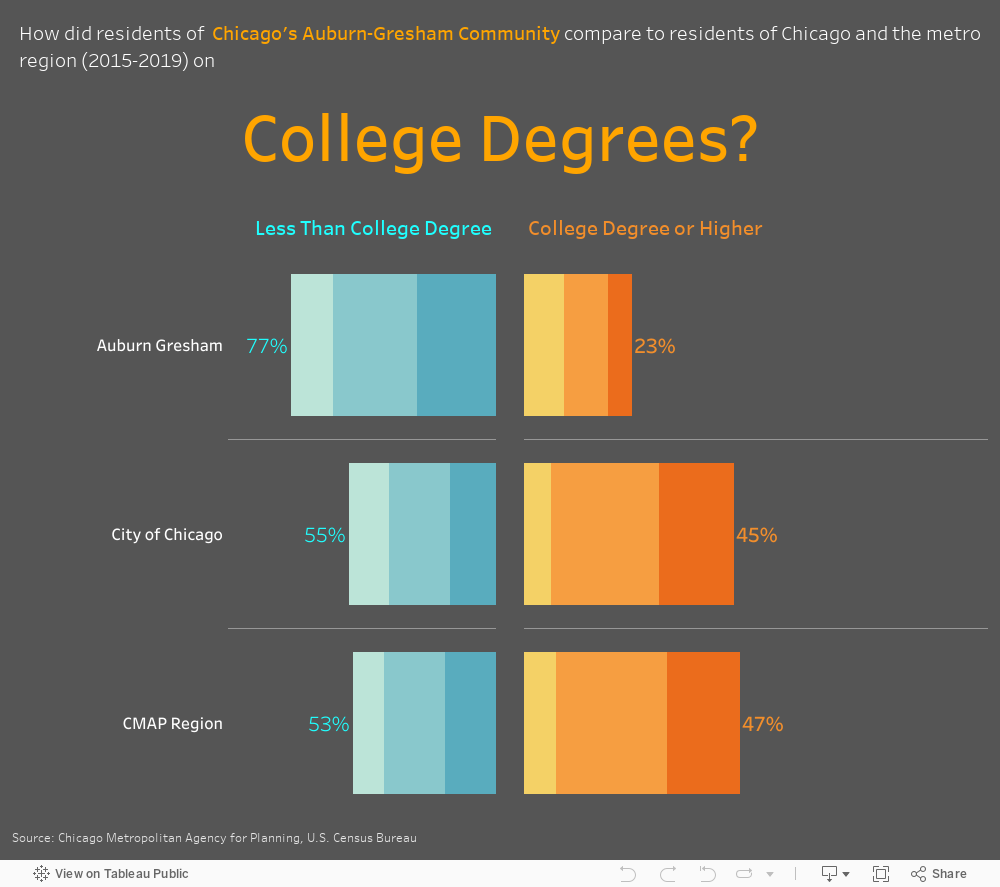
I hope you at least got this from your 5-second review: Auburn-Gresham’s residents were much less likely to have a college degree than residents of the city/metro area in general. Here’s what I did:
Aggregated the groups into just two larger groups: those with and without college degrees. And I distinguished the groups with labels and colors. What makes a clustered bar chart confusing is the requirement to review multiple groups and compare the bars within each one of them.
Retained the subgroups but de-emphasized them so that they do not distract the viewer from the larger story. Each subgroup is represented by a shade of orange or blue and the exact percent of residents in each group is available on demand by scrolling over the bar segments.
Converted to a diverging bar chart to allow the viewer to more easily compare the size of the college and no-college groups.
Changed the title to a question to clarify what the viewer can learn from the chart.
To see past data tips, click HERE.
Let’s talk about YOUR data!
Got the feeling that you and your colleagues would use your data more effectively if you could see it better? Data Viz for Nonprofits (DVN) can help you get the ball rolling with an interactive data dashboard and beautiful charts, maps, and graphs for your next presentation, report, proposal, or webpage. Through a short-term consultation, we can help you to clarify the questions you want to answer and goals you want to track. DVN then visualizes your data to address those questions and track those goals.


