10 Tips for Presenting Data Like An Artist

Resposted from March 2021

To make great charts, maps, and graphs, you need to channel both your inner analyst and your inner artist. Here are 10 rules about composition that artists know and that analysts (and the rest of us) can apply when presenting data. Bookmark it! Print it out and pin it to your bulletin board!


Let’s talk about YOUR data!

Got the feeling that you and your colleagues would use your data more effectively if you could see it better? Data Viz for Nonprofits (DVN) can help you get the ball rolling with an interactive data dashboard and beautiful charts, maps, and graphs for your next presentation, report, proposal, or webpage. Through a short-term consultation, we can help you to clarify the questions you want to answer and goals you want to track. DVN then visualizes your data to address those questions and track those goals.


Composition Rules Cheat Sheet

60-SECOND DATA TIP_3.png

Over the past 10 weeks, I’ve given you composition rules to elevate your data viz. Today I give you the cheat sheet. Bookmark it! Print it out and pin it to your bulletin board!


Let’s talk about YOUR data!

Got the feeling that you and your colleagues would use your data more effectively if you could see it better? Data Viz for Nonprofits (DVN) can help you get the ball rolling with an interactive data dashboard and beautiful charts, maps, and graphs for your next presentation, report, proposal, or webpage. Through a short-term consultation, we can help you to clarify the questions you want to answer and goals you want to track. DVN then visualizes your data to address those questions and track those goals.


10 Rules To Elevate Your Data Viz (Rule #10)

60-SECOND DATA TIP_3.png

Here is a simple strategy you can take from the graphic design playbook to make your data viz better: divide your design into thirds. It’s one of 10 composition rules for good design. Here’s the 60-second version of this rule.

Composition Rules (#10) by Amelia Kohm

What Does “Divide Your Design Into Thirds” Mean?

To apply the “rule of thirds” strategy, create a grid on your screen (or paper, if you’re old school) with three rows and three columns. Then place your focal points at the intersections of the vertical and horizontal lines. But avoid placing anything in the exact middle. This approach goes all the way back to the Renaissance artists who found it made for a pleasing composition. Some say it gives the eye places to move without getting stuck in the middle.

How Can I Apply This Rule to Data Viz?

As far as I can tell, data visualizers have not embraced this rule. I was hard pressed to find any good examples. But I think it’s something more of us should keep in mind. It is a time-tested method for arriving at a balanced and interesting composition. Consider placing key text, images, and charts according to the rule of thirds.

To be clear, when you place the focal points within the cells of a 3 x 3 grid, you are NOT applying the rule of thirds. As you can see in this example, the focal points are not at the intersections of the grid (which I’ve superimposed on the dashboard). Sure, it makes for a clean, user-friendly composition, but it’s probably not the most exciting thing you’ve ever seen.

Source: Varun Goenka on Tableau Public

Source: Varun Goenka on Tableau Public

This is the only dashboard I came across, after several hours of searching, that came close to the rule of thirds. Again, I’ve superimposed the grid, and you can see that the intersections do land on some key elements, including one key data point on the Number of Visits per Day graph. And it does have a more dynamic feel than the dashboard above.

Source: : Seema M. Rathod on Tableau Public

Source: : Seema M. Rathod on Tableau Public

Since I couldn’t find a great data viz example of the rule of thirds (either in my own portfolio or others’), I leave you with this mock-up for a dashboard which I made to show you just how pleasing this approach can be when applied to a data viz composition. Now you try it!

nogride@2x.png

And here it is with the grid that I used to place the elements.

withgrid@2x.png

To see past data tips, including those about other composition rules, click HERE.


Let’s talk about YOUR data!

Got the feeling that you and your colleagues would use your data more effectively if you could see it better? Data Viz for Nonprofits (DVN) can help you get the ball rolling with an interactive data dashboard and beautiful charts, maps, and graphs for your next presentation, report, proposal, or webpage. Through a short-term consultation, we can help you to clarify the questions you want to answer and goals you want to track. DVN then visualizes your data to address those questions and track those goals.


10 Rules To Elevate Your Data Viz (Rule #9)

“Good design is like a refrigerator—when it works, no one notices, but when it doesn’t, it sure stinks.”

–Irene Au

A jumble of elements in any design, including data visualization design, stinks. That’s why alignment is one of 10 composition rules for good design. Here’s the 60-second version of this rule.

Composition Rules (#9) by Amelia Kohm

What Does “Align Elements” Mean?

Alignment is placing text and other design elements so they line up. It orders and organizes your elements. It also creates visual connections and improves the overall readability of a design. You can align elements to a margin or to other elements in a design. Elements can also be aligned along a central axis.

How Can I Apply This Rule to Data Viz?

Aligning charts, maps, graphs, titles, subtitles, and other elements of a data viz design is a simple way to bring order to your composition. Like straightening up a messy room, aligning elements makes it easier for the viewer to navigate the design and find information. Also, a clean design, like a clean room, is more inviting.

To improve alignment, consider:

  • Using left alignment with text in most cases. It’s how we read and usually works best. Only use right or center alignment with a small amount of text (like a title or subtitle).

  • Using a grid. Many design and data viz tools have grid overlays. Some can snap your elements onto your grid.

Now let’s consider some examples.

In this dashboard, the charts, maps, titles, and text boxes are aligned both vertically and horizontally along a 4 x 3 grid. The result is a balanced and approachable look despite the multitude of charts and text elements.

Source: Dzifa Amexo on Tableau Public

Source: Dzifa Amexo on Tableau Public

This composition uses both left and right alignment to create a serene, symmetrical design. The designer emphasizes alignment by adding actual lines along some of the text elements.

Source: Dhruv Popat on Tableau Public

Source: Dhruv Popat on Tableau Public

This diverging bar chart makes good use of center alignment, but the numbers at the top are not aligned with the text and chart below, giving it an off-kilter feel.

Source: Sanaz Jamloo on Tableau Public

Source: Sanaz Jamloo on Tableau Public

To see past data tips, including those about other composition rules, click HERE.


Let’s talk about YOUR data!

Got the feeling that you and your colleagues would use your data more effectively if you could see it better? Data Viz for Nonprofits (DVN) can help you get the ball rolling with an interactive data dashboard and beautiful charts, maps, and graphs for your next presentation, report, proposal, or webpage. Through a short-term consultation, we can help you to clarify the questions you want to answer and goals you want to track. DVN then visualizes your data to address those questions and track those goals.


10 Rules To Elevate Your Data Viz (Rule #8)

trees (1).gif

Design — including data viz design — is about both the elements that you include (text, images, charts, etc.) and about the space between them. Using this “white space” strategically is one of ten composition rules discussed in greater detail in this article from Canva. Read on for the 60-second version of this rule.

Composition Rules (#8) by Amelia Kohm

What Does “White Space” Mean?

“White space” is the space between and around elements in a design. Think of a single tree in an empty field versus a tree surrounded by other trees in a forest. If you want the viewer to focus on a particular tree (or chart, chart element, or title) clear the area around it.

How Can I Apply This Rule to Data Viz?

Too often we look for ways to pack more information into a dashboard or other type of data viz design. But when we do this, we lose the power of white space.

Use white space to draw attention to your focal points. Use white space to give the eye some breathing room. And, as long as I’m mixing metaphors, consider this: a busy, crowded design is a cacophony in which none of the individual components can be fully appreciated. So delete unnecessary elements or, if the viz is interactive, make additional information available on demand by scrolling or clicking a button.

Here’s an example of a dashboard that crowds information into one view, leaving little white space. As a result, it’s difficult to determine the focal points and, unless you are familiar with the data or highly motivated to extract meaning, you may give up on it quickly.

Source: Peter James Walker on Tableau Public

Source: Peter James Walker on Tableau Public

This dashboard, by contrast, uses plenty of white space to highlight focal points and not overwhelm the viewer.

Source: Sarah Burnett on Tableau Public

Source: Sarah Burnett on Tableau Public

To see past data tips, including those about other composition rules, click HERE.


Let’s talk about YOUR data!

Got the feeling that you and your colleagues would use your data more effectively if you could see it better? Data Viz for Nonprofits (DVN) can help you get the ball rolling with an interactive data dashboard and beautiful charts, maps, and graphs for your next presentation, report, proposal, or webpage. Through a short-term consultation, we can help you to clarify the questions you want to answer and goals you want to track. DVN then visualizes your data to address those questions and track those goals.


10 Rules To Elevate Your Data Viz (Rule #7)

60-SECOND DATA TIP_3.png

“Rhythm is music’s pattern in time. Whatever other elements a given piece of music may have (e.g., patterns in pitch or timbre), rhythm is the one indispensable element of all music.” (Britannica.com). Repetition serves the same role in visual composition as rhythm does in music. And it’s one of ten composition rules discussed in greater detail in this article from Canva. Read on for the 60-second version of this rule.

Composition Rules (#7) by Amelia Kohm

What Does “Repeat Elements of Your Design” Mean?

Like rhythm in music, repetition brings unity to any design. It marries disparate elements. In a single composition, repeating typeface, color, shapes, or images can result in a balanced, coordinated look. In a series of compositions, repeating visual elements helps to tie them together, communicating that each is part of a larger whole.

How Can I Apply This Rule to Data Viz?

It’s a good idea to keep a record of the typefaces, type sizes, line weights, colors, etc. that you use in any data viz project ( (aka a “style guide”), and look for opportunities to repeat them. When designing a multi-page dashboard, using similar styes and layouts for each will help the user to find information quickly.

Let’s consider some examples of data viz that effectively use repetition.

Small multiples charts show the power of repetition. Zach Gemignani describes this approach well. “Small multiples use the same basic graphic or chart to display difference slices of a data set. Small multiples can show rich, multi-dimensional data without trying to cram all that information into a single, overly-complex chart.” Once you know how to read one of the side-by-side charts, you can quickly extract meaning from the whole array. The small multiples chart below allows us to rapidly discern that women directors have directed a small percentage of the most popular movies regardless of genre, with no clear improvement over time.

Source Max Tham on Tableau Public

Source Max Tham on Tableau Public

This dashboard repeats the same charts and KPIs for each unit in a hospital. It allows administrators to rapidly assess the current need and distribution of resources, compare units, and adjust resources accordingly. Repetition of color, fonts, and header styles also helps to unify information about different units.

Source: Slalom NYC on Tableau Public

Source: Slalom NYC on Tableau Public

In this series of dashboards on crises in various African nations, Alexander Varlamo uses a strict style guide to unify them.

Source: Alexander Varlamov on Tableau Public

Source: Alexander Varlamov on Tableau Public

To see past data tips, including those about other composition rules, click HERE.


Let’s talk about YOUR data!

Got the feeling that you and your colleagues would use your data more effectively if you could see it better? Data Viz for Nonprofits (DVN) can help you get the ball rolling with an interactive data dashboard and beautiful charts, maps, and graphs for your next presentation, report, proposal, or webpage. Through a short-term consultation, we can help you to clarify the questions you want to answer and goals you want to track. DVN then visualizes your data to address those questions and track those goals.


10 Rules To Elevate Your Data Viz (Rule #6)

60-SECOND DATA TIP_3.png

Today I give you a composition rule which is often ignored in data viz — but at its peril. The rule is deploy contrast. It’s one of ten composition rules discussed in greater detail in this article from Canva. Read on for the 60-second version of this rule.

Composition Rules (#6) by Amelia Kohm

What Does “Boosting or Reducing Contrast” Mean?

Our brains are wired to perceive objects that differ significantly from their background. The objects that really pop out are those that contrast due to their color, size, orientation, or motion. So when designing charts, maps, and graphs, we should give some thought to contrast.

How Can I Apply This Rule to Data Viz?

Not only do we want our focal points to pop out, we also want some aspects of the composition, those lower in the hierarchy, to fade a bit by NOT contrasting as strongly with the background. By doing this, we not only help our main titles, captions, and data points to shine, we also provide more information for the interested viewer.

Let’s consider some examples of data viz that effectively use contrast.

Below is a series of visualizations related to the 2020 explosion in Beirut. It uses contrasting size and color to make some elements pop (the title, the KPIs, and the location of destruction and damage on the map) and other elements fade backward (the explanatory text and location of other ammonium nitrate disasters.)

Source: Soha Elghany on Tableau Public

Source: Soha Elghany on Tableau Public

Similarly these vizes, showing rat sightings in New York, effectively use shades of gray so that the viewer can easily pick out the locations where — and the years and months when — rats are most visible.

Source: Claire Kim on Tableau Public

Source: Claire Kim on Tableau Public

In these vizes, red and white contrast with the black background. Red is used for key information about poverty. White is used for important contextual information. And gray is used for everything else.

Source: Ash Shih on Tableau Public

Source: Ash Shih on Tableau Public

To see past data tips, including those about other composition rules, click HERE.


Let’s talk about YOUR data!

Got the feeling that you and your colleagues would use your data more effectively if you could see it better? Data Viz for Nonprofits (DVN) can help you get the ball rolling with an interactive data dashboard and beautiful charts, maps, and graphs for your next presentation, report, proposal, or webpage. Through a short-term consultation, we can help you to clarify the questions you want to answer and goals you want to track. DVN then visualizes your data to address those questions and track those goals.


10 Rules To Elevate Your Data Viz (Rule #5)

60-SECOND DATA TIP_3.png

Using complementing elements is one of ten composition rules discussed in greater detail in this article from Canva. And it applies as much to data viz as to any other type of composition. Read on for the 60-second version of this rule.

Composition Rules (#5) by Amelia Kohm

What Does “Use Complementing Elements” Mean?

Graphic design artists choose images that look good together. Data visualizers should do the same by making sure that charts, maps, and graphs which are presented together complement each other visually,

How Can I Apply This Rule to Data Viz?

  • Use the same color palette in each chart. And remember that the meaning of a color should be the same in side-by-side charts. You should not use a dark blue to signify participants aged 20-40 in one chart and to signify those living in a particular zip code area in an adjacent chart.

  • Use the same chart type for each chart. Part of the beauty of the small multiple chart is that the elements of the composition complement each other due to their similarity. Please see example below.

  • Use consistent type in each chart. You wouldn’t use different fonts or font sizes in side-by-side charts, would you? Yes? Well, then this tip is for you.

  • Use similar marks and channels in each chart. Data visualizations represent data using “marks” such as bars, lines, and circles. A mark represents data through “channels” which include its position, shape, size, or color. A larger circle, for example, can mean a greater number of something than a smaller circle. Charts that use similar marks and channels have similar looks and thus tend to complement each other visually.

Let’s look at some examples.

This dashboard repeats colors, charts, and marks and so, although a lot of different data is presented, the overall look is unified because the elements complement each other.

Source: Alex Dixon and Tarannum Ansari on Tableau Public

Source: Alex Dixon and Tarannum Ansari on Tableau Public

The repetition of chart types in small multiples charts, like this one, makes for a cohesive overall design.

Source: Christian Felix on Tableau Public

Source: Christian Felix on Tableau Public

And here again, the designer repeats visual elements such as text boxes and chart types to bring the different aspects of the composition together.

Source: Chantilly Jaggernauth on Tableau Public

Source: Chantilly Jaggernauth on Tableau Public

To see past data tips, including those about other composition rules, click HERE.


Let’s talk about YOUR data!

Got the feeling that you and your colleagues would use your data more effectively if you could see it better? Data Viz for Nonprofits (DVN) can help you get the ball rolling with an interactive data dashboard and beautiful charts, maps, and graphs for your next presentation, report, proposal, or webpage. Through a short-term consultation, we can help you to clarify the questions you want to answer and goals you want to track. DVN then visualizes your data to address those questions and track those goals.


10 Rules To Elevate Your Data Viz (Rule #4)

60-SECOND DATA TIP_3.png

Balancing out your elements is one of ten composition rules discussed in greater detail in this article from Canva. And it applies as much to data viz as to other types of composition. Read on for the 60-second version of this rule.

Composition Rules (#4) by Amelia Kohm

What Does “Balancing Elements” Mean?

Think of how you balance things on an old fashioned balance scale (pictured above). You can achieve balance by:

1) Placing the same elements on each side. This is called symmetrical balance.

2) Placing an assortment of elements which total to the same weight on each side. This is called asymmetrical balance.

What do we mean by weight when it comes to design? Well, more prominent (larger, darker, brighter) objects have more weight than less prominent ones.

How Can I Apply This Rule to Data Viz?

When designing a dashboard or any other type of composition that involves data viz, give some thought to where you place elements to balance them out.

The top part of this dashboard shows asymmetrical balance. The title and text on the left are balanced by the mini charts and KPI* on the right. The small multiples chart that comprises the rest of the dashboard is an example of symmetrical balance.

This dashboard achieves asymmetrical balance by placing the title and text in the upper left corner and information about the City of Toronto in the lower right corner. The map, which crosses from the lower left to the upper right, is placed for symmetry as well. Each quadrant of the composition has similar weight.

To see past data tips, including those about other composition rules, click HERE.

*KPI: Key Performance Indicator


Let’s talk about YOUR data!

Got the feeling that you and your colleagues would use your data more effectively if you could see it better? Data Viz for Nonprofits (DVN) can help you get the ball rolling with an interactive data dashboard and beautiful charts, maps, and graphs for your next presentation, report, proposal, or webpage. Through a short-term consultation, we can help you to clarify the questions you want to answer and goals you want to track. DVN then visualizes your data to address those questions and track those goals.


10 Rules To Elevate Your Data Viz (Rule #3)

60-SECOND DATA TIP_3 (1).png

Graphic artists think about hierarchy whenever they design anything. Analysts making charts and graphs often ignore hierarchy, but at their peril. This is one of ten composition rules discussed in greater detail in this article from Canva. Read on for the 60-second data viz version of this rule.

Composition Rules (#3) by Amelia Kohm

What Does “Hierarchy” Mean?

You create a hierarchy when you design elements (like text, images, and charts) according to their significance. Generally, the most significant elements are bigger and bolder, and the less significant ones are smaller and fainter. We’ve already talked about making your focal point big, bold, and centrally located. We’ve also talked about using leading lines to direct attention from the focal point to other elements in the composition. The visual hierarchy provides additional cues to help the viewer discern: 1) what are the key takeaways, and 2) what are the more minor details.

How Can I Apply This Rule to Data Viz?

Consider the most important elements of your data viz including titles, subtitles, labels, charts, and chart elements (such as particular lines on a line chart or particular dots on a scatterplot.) Then make your most important elements bigger or bolder. You might also add more white space around them or give them a contrasting color to the rest of the viz. Then make the less important elements smaller and/or fainter.

Below are two versions of a data dashboard by Swati Dave. The first image shows the dashboard with many of the hierarchy cues removed. The second image show’s Dave’s original dashboard which applies a visual hierarchy to help guide you through the viz. Which do you find easier to digest?

Dashboard With Few Hierarchy Cues

bad hierarchy.png

Dashboard With More Hierarchy Cues

Good hierarchy.png

To see past data tips, including those about other composition rules, click HERE.


Let’s talk about YOUR data!

Got the feeling that you and your colleagues would use your data more effectively if you could see it better? Data Viz for Nonprofits (DVN) can help you get the ball rolling with an interactive data dashboard and beautiful charts, maps, and graphs for your next presentation, report, proposal, or webpage. Through a short-term consultation, we can help you to clarify the questions you want to answer and goals you want to track. DVN then visualizes your data to address those questions and track those goals.


10 Rules to Elevate Your Data Viz (Rule #2)

60-SECOND DATA TIP_3.png

Here’s another composition rule that artists know and that analysts can apply when presenting data: direct the eye with leading lines. This is one of ten rules discussed in greater detail in this article from Canva.

What Does “Direct The Eye With Leading Lines” Mean?

The first thing you want your audience to see is the focal point. Leading lines are like signposts which tell the viewer where to go after the focal point. They can be lines, arrows, or other shapes which guide viewers’ eyes in a certain direction.

How Can I Apply This Rule to Data Viz?

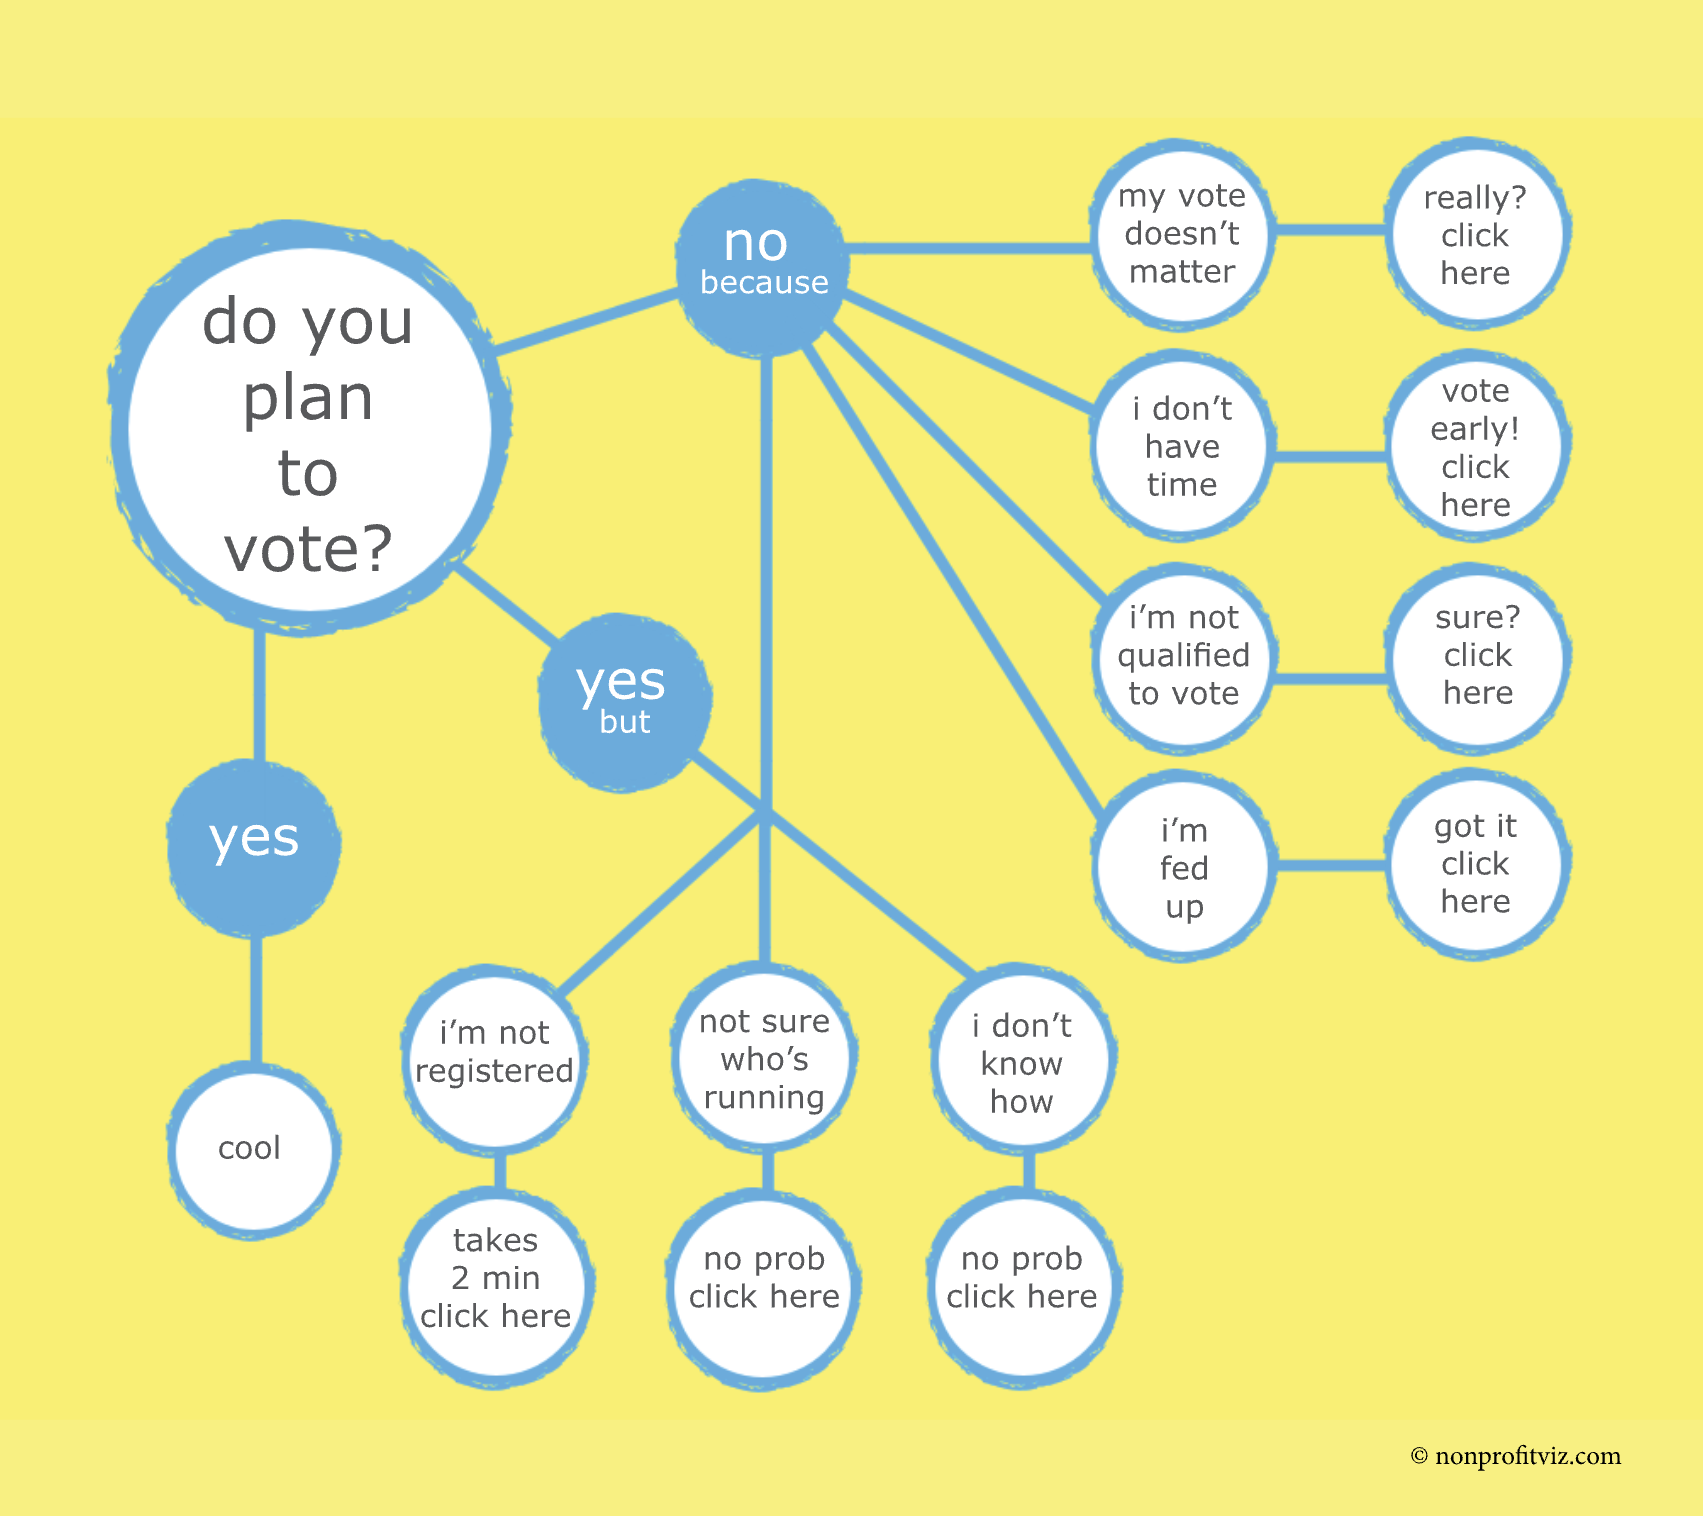
Flowcharts, as I’ve written before, are engaging, easy to digest, and charmingly analog. And what makes them so user-friendly are the leading lines directing our attention from the focal point (in this case: “Do you plan to vote?”) to other elements of the chart.

Source: Christian Felix on Tableau Public

Source: Christian Felix on Tableau Public

This chart on air quality uses leading lines to relate the bar chart at the top to locations on the world map below.

Source: Pradeep Kumar G on Tableau Public

Source: Pradeep Kumar G on Tableau Public

Leading lines can be used to draw attention to particular data points. In this chart, leading lines are used to direct your focus to foods that have a particularly high and low carbon footprint.

To see past data tips, including those about other composition rules, click HERE.


Let’s talk about YOUR data!

Got the feeling that you and your colleagues would use your data more effectively if you could see it better? Data Viz for Nonprofits (DVN) can help you get the ball rolling with an interactive data dashboard and beautiful charts, maps, and graphs for your next presentation, report, proposal, or webpage. Through a short-term consultation, we can help you to clarify the questions you want to answer and goals you want to track. DVN then visualizes your data to address those questions and track those goals.


10 Rules to Elevate Your Data Viz (Rule #1)

60-SECOND DATA TIP_3.png

Data visualization is like one of those unlikely couples. One partner is outgoing and a great storyteller. The other is introverted and sticks to the facts. To make great charts, maps, and graphs, you need to channel both partners in this odd couple: the artist and the analyst.

So over the next several weeks, I’m going to offer up key rules about composition that artists know and that analysts (and the rest of us) can apply when presenting data. I will focus on ten rules discussed in more detail in this article from Canva. This time it’s about finding your focus.

Composition Rules (#1) by Amelia Kohm

What Does “Find Your Focus” Mean?

Decide what you want your audience to focus on first. To choose a focal point, think about the main message you hope to communicate. You can direct attention to words or data points related to your focal point by placing them in the center of the composition, by coloring them so that they contrast with the background, or by using larger type than used elsewhere in the composition.

How Can I Apply This Rule to Data Viz?

Source: Richard Speigal on Tableau Public

Source: Richard Speigal on Tableau Public

This map uses contrasting color to direct your attention to the focal point: the location of lighthouses in England and Wales. The focal point is also the title, which is in much larger type than the rest of the text. Finally, the color chosen looks like radiating light, further emphasizing the focal point.

Source: Agata Ketterick on Tableau Public

Source: Agata Ketterick on Tableau Public

This map also uses contrasting color to clarify the focal point: locations of extreme snowfall. And it uses color strategically: white=snow. These locations are placed in the center of the image and further emphasized by the bar chart.

Source: Zainab Ayodimeji on Tableau Public

Source: Zainab Ayodimeji on Tableau Public

This simple bar chart uses the title and contrasting colors to ensure that you don’t miss the focal point.

Stay tuned for more composition rules in coming weeks!

To see past data tips, click HERE.


Let’s talk about YOUR data!

Got the feeling that you and your colleagues would use your data more effectively if you could see it better? Data Viz for Nonprofits (DVN) can help you get the ball rolling with an interactive data dashboard and beautiful charts, maps, and graphs for your next presentation, report, proposal, or webpage. Through a short-term consultation, we can help you to clarify the questions you want to answer and goals you want to track. DVN then visualizes your data to address those questions and track those goals.