It’s pie season, so we might as well talk about pie charts. The pie chart turns 225 this year. William Playfair published the first one in 1801, and it had just three slices.
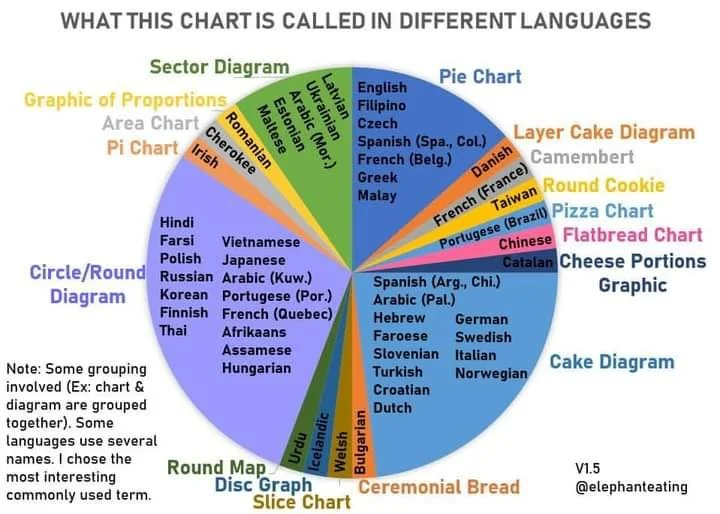
Which brings me to one of my favorite pie charts ever. In February 2021, researcher Eric Hittinger (@ElephantEating) posted this chart on X, then still Twitter. It shows what a pie chart is called in different languages. He was inspired after reviewing a paper for a French-language journal and learning that the French call a pie chart a camembert. In Brazilian Portuguese it’s a pizza chart. In Chinese it’s a flatbread chart. In German and Italian it’s a cake diagram.
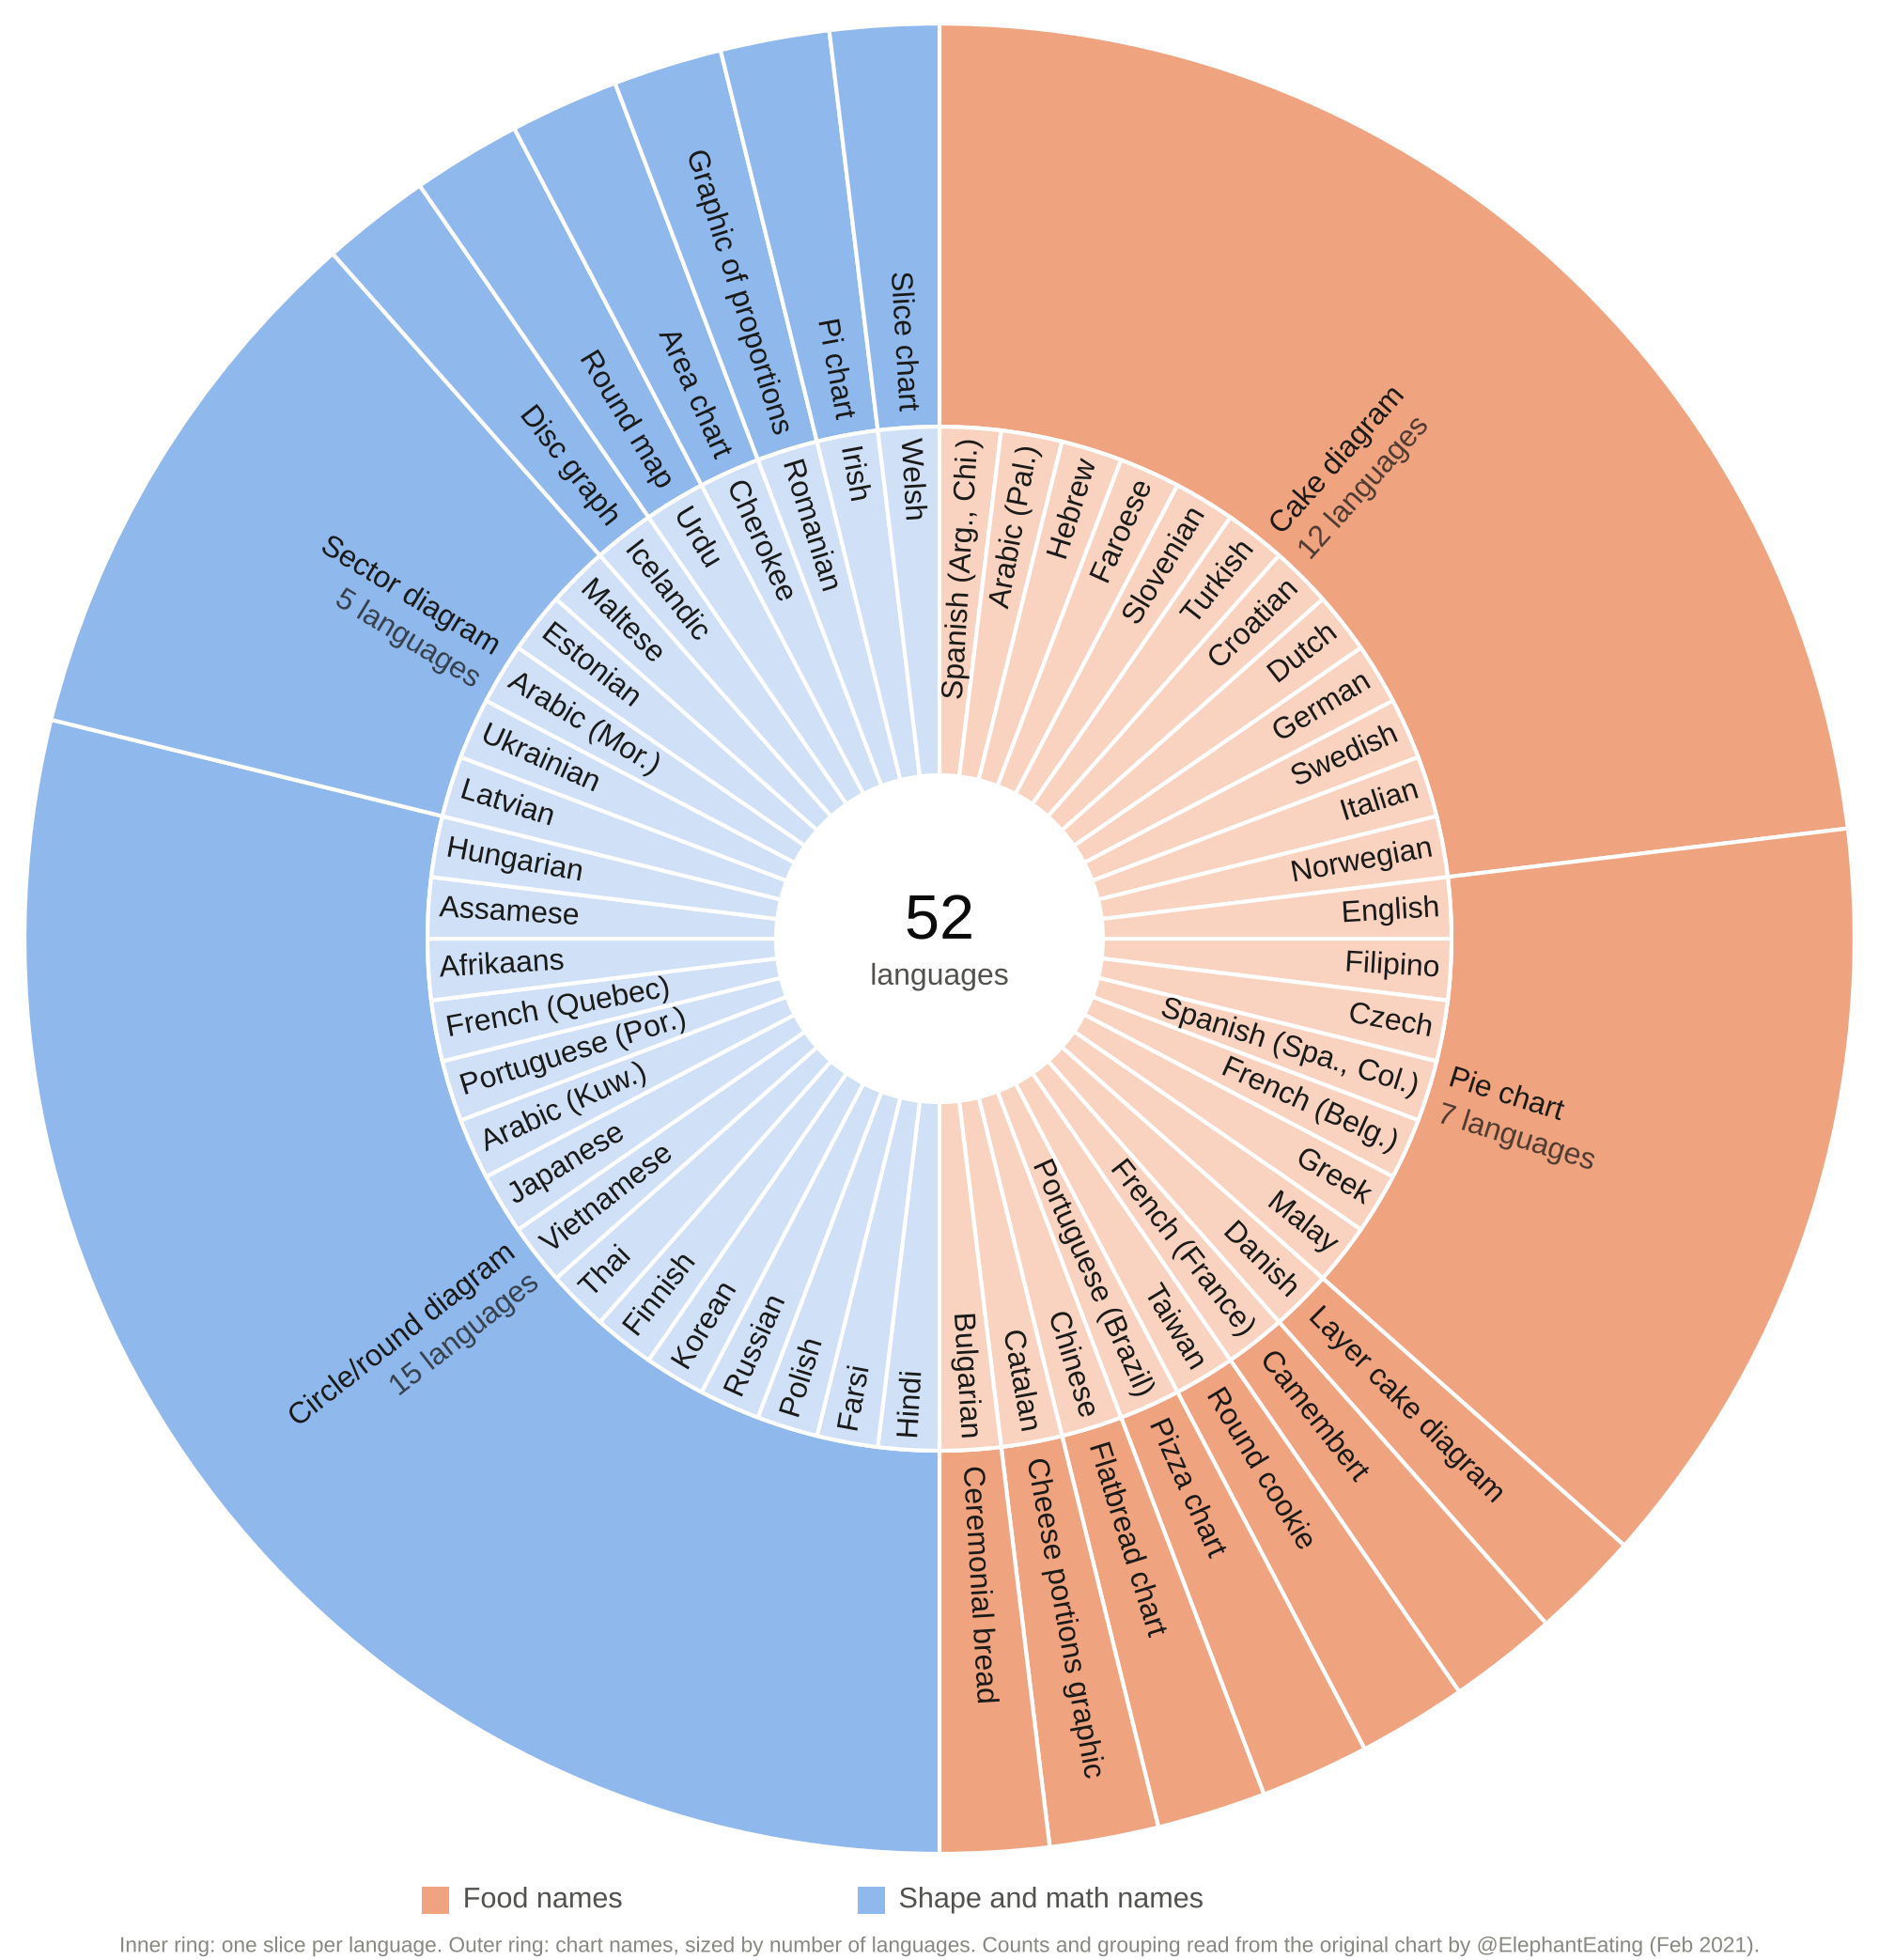
It’s a fun chart even if the slice sizes appear not to be based on any actual data. If the slice sizes represented the number of languages that use each term, it might work better. Check out the sunburst chart below. It’s a variant of the pie/camembert/pizza/etc. chart. The inner ring has one slice per language listed on the original chart. The outer ring shows the chart names, sized by how many languages use each.
For nonprofits, a sunburst can work for hierarchical data, such as funding sources broken down by individual grants, or programs broken down by services. Use it to show structure. Bar charts work better if readers need to make more accurate comparisons.
Sources: @ElephantEating on X, February 2021; Ian Spence, “No Humble Pie” (2005).
Let’s talk about YOUR data!
Got the feeling that you and your colleagues would use your data more effectively if you could see it better? Data Viz for Nonprofits (DVN) can help you get the ball rolling with an interactive data dashboard and beautiful charts, maps, and graphs for your next presentation, report, proposal, or webpage. Through a short-term consultation, we can help you to clarify the questions you want to answer and goals you want to track. DVN then visualizes your data to address those questions and track those goals.