What can you learn from data vizzers? (Definition: one who visualizes data, I think I just coined this term.)
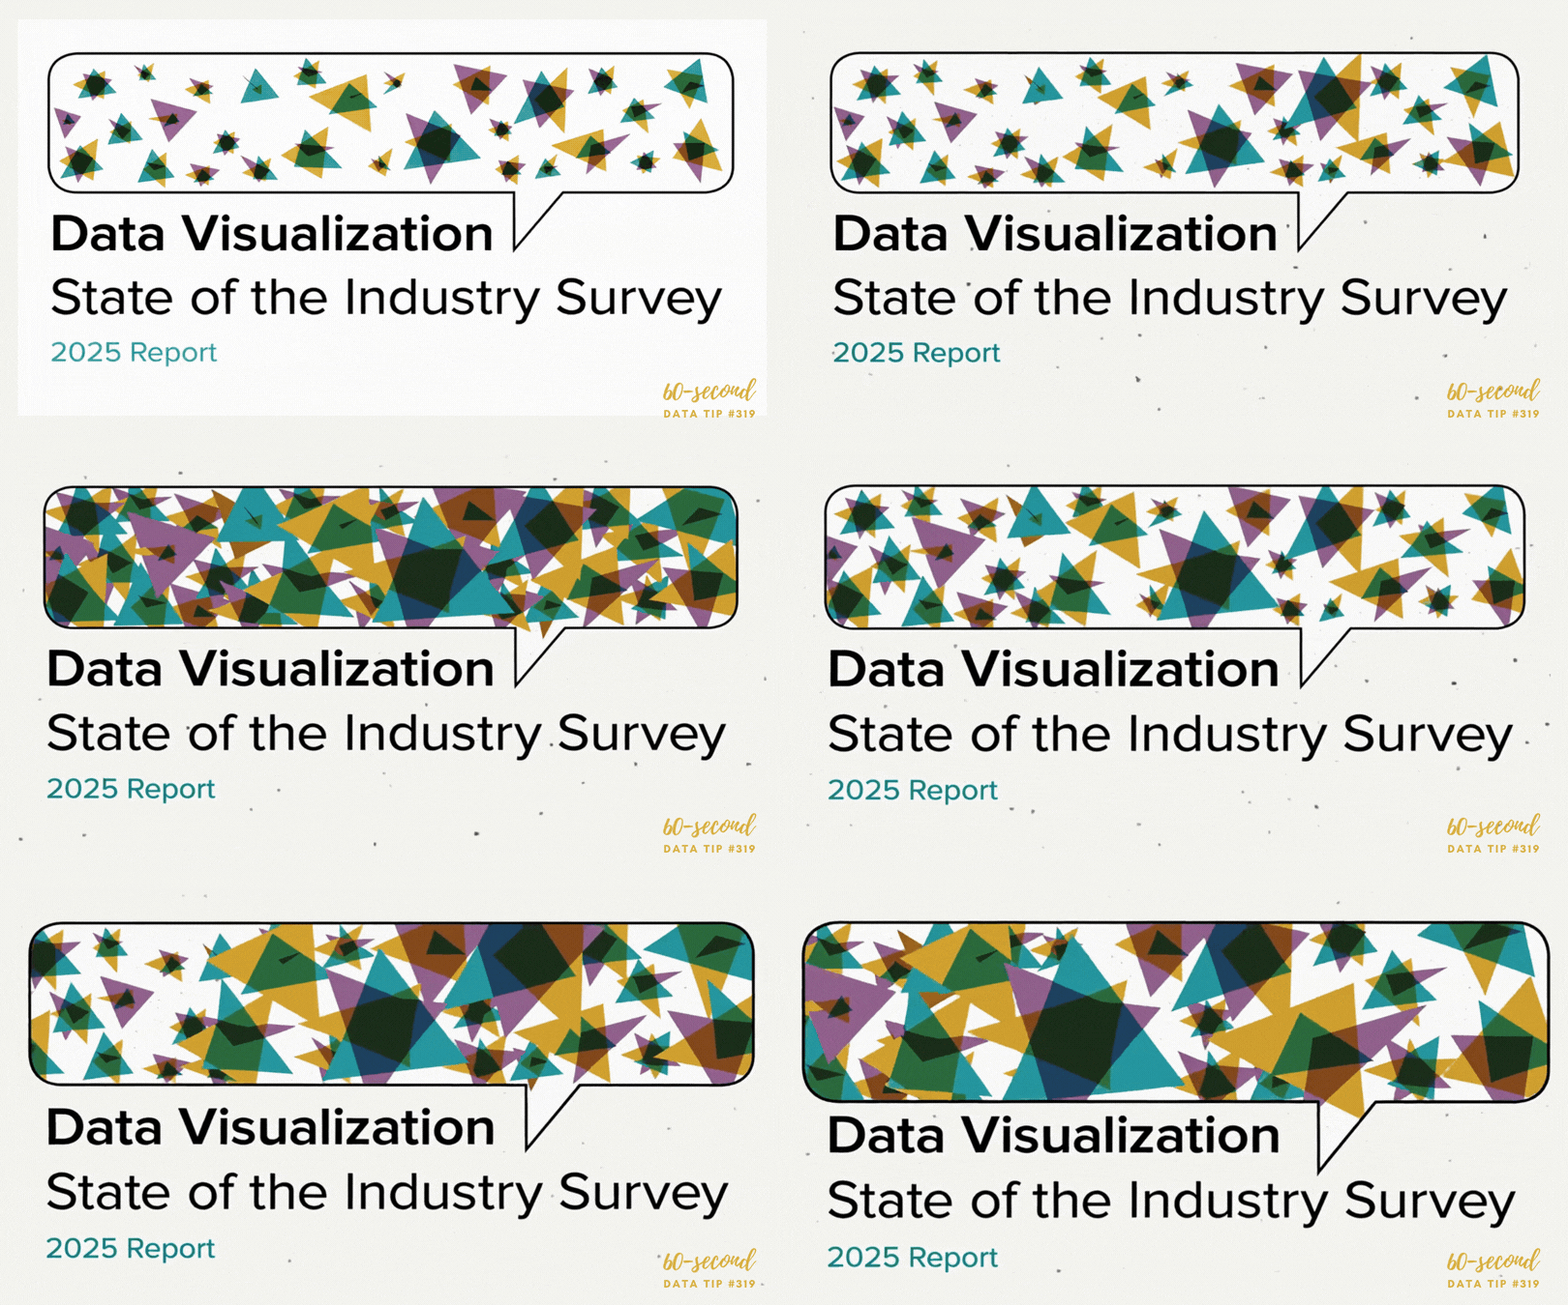
The Data Visualization Society recently published its 2025 State of the Industry Report, an annual survey of people who do data visualization work across sectors including analysts, designers, data scientists, academics, and consultants. These are people for whom data visualization is a primary focus, not one of many hats they wear on a given Tuesday. Which makes their workflow habits worth paying attention to, even if your context looks very different.
Here’s what nonprofit folks can learn from data vizzers:
The tools are more accessible than you think. Excel has been the most-used tool in this survey for seven years running, used by 67% of respondents. Pen and paper still shows up in 60% of workflows. Tableau is the most enjoyed tool, but Microsoft tools dominate actual day-to-day use. The takeaway for nonprofits: you don’t need specialized software to do good data visualization work. The tools you already have are the tools the pros use too.
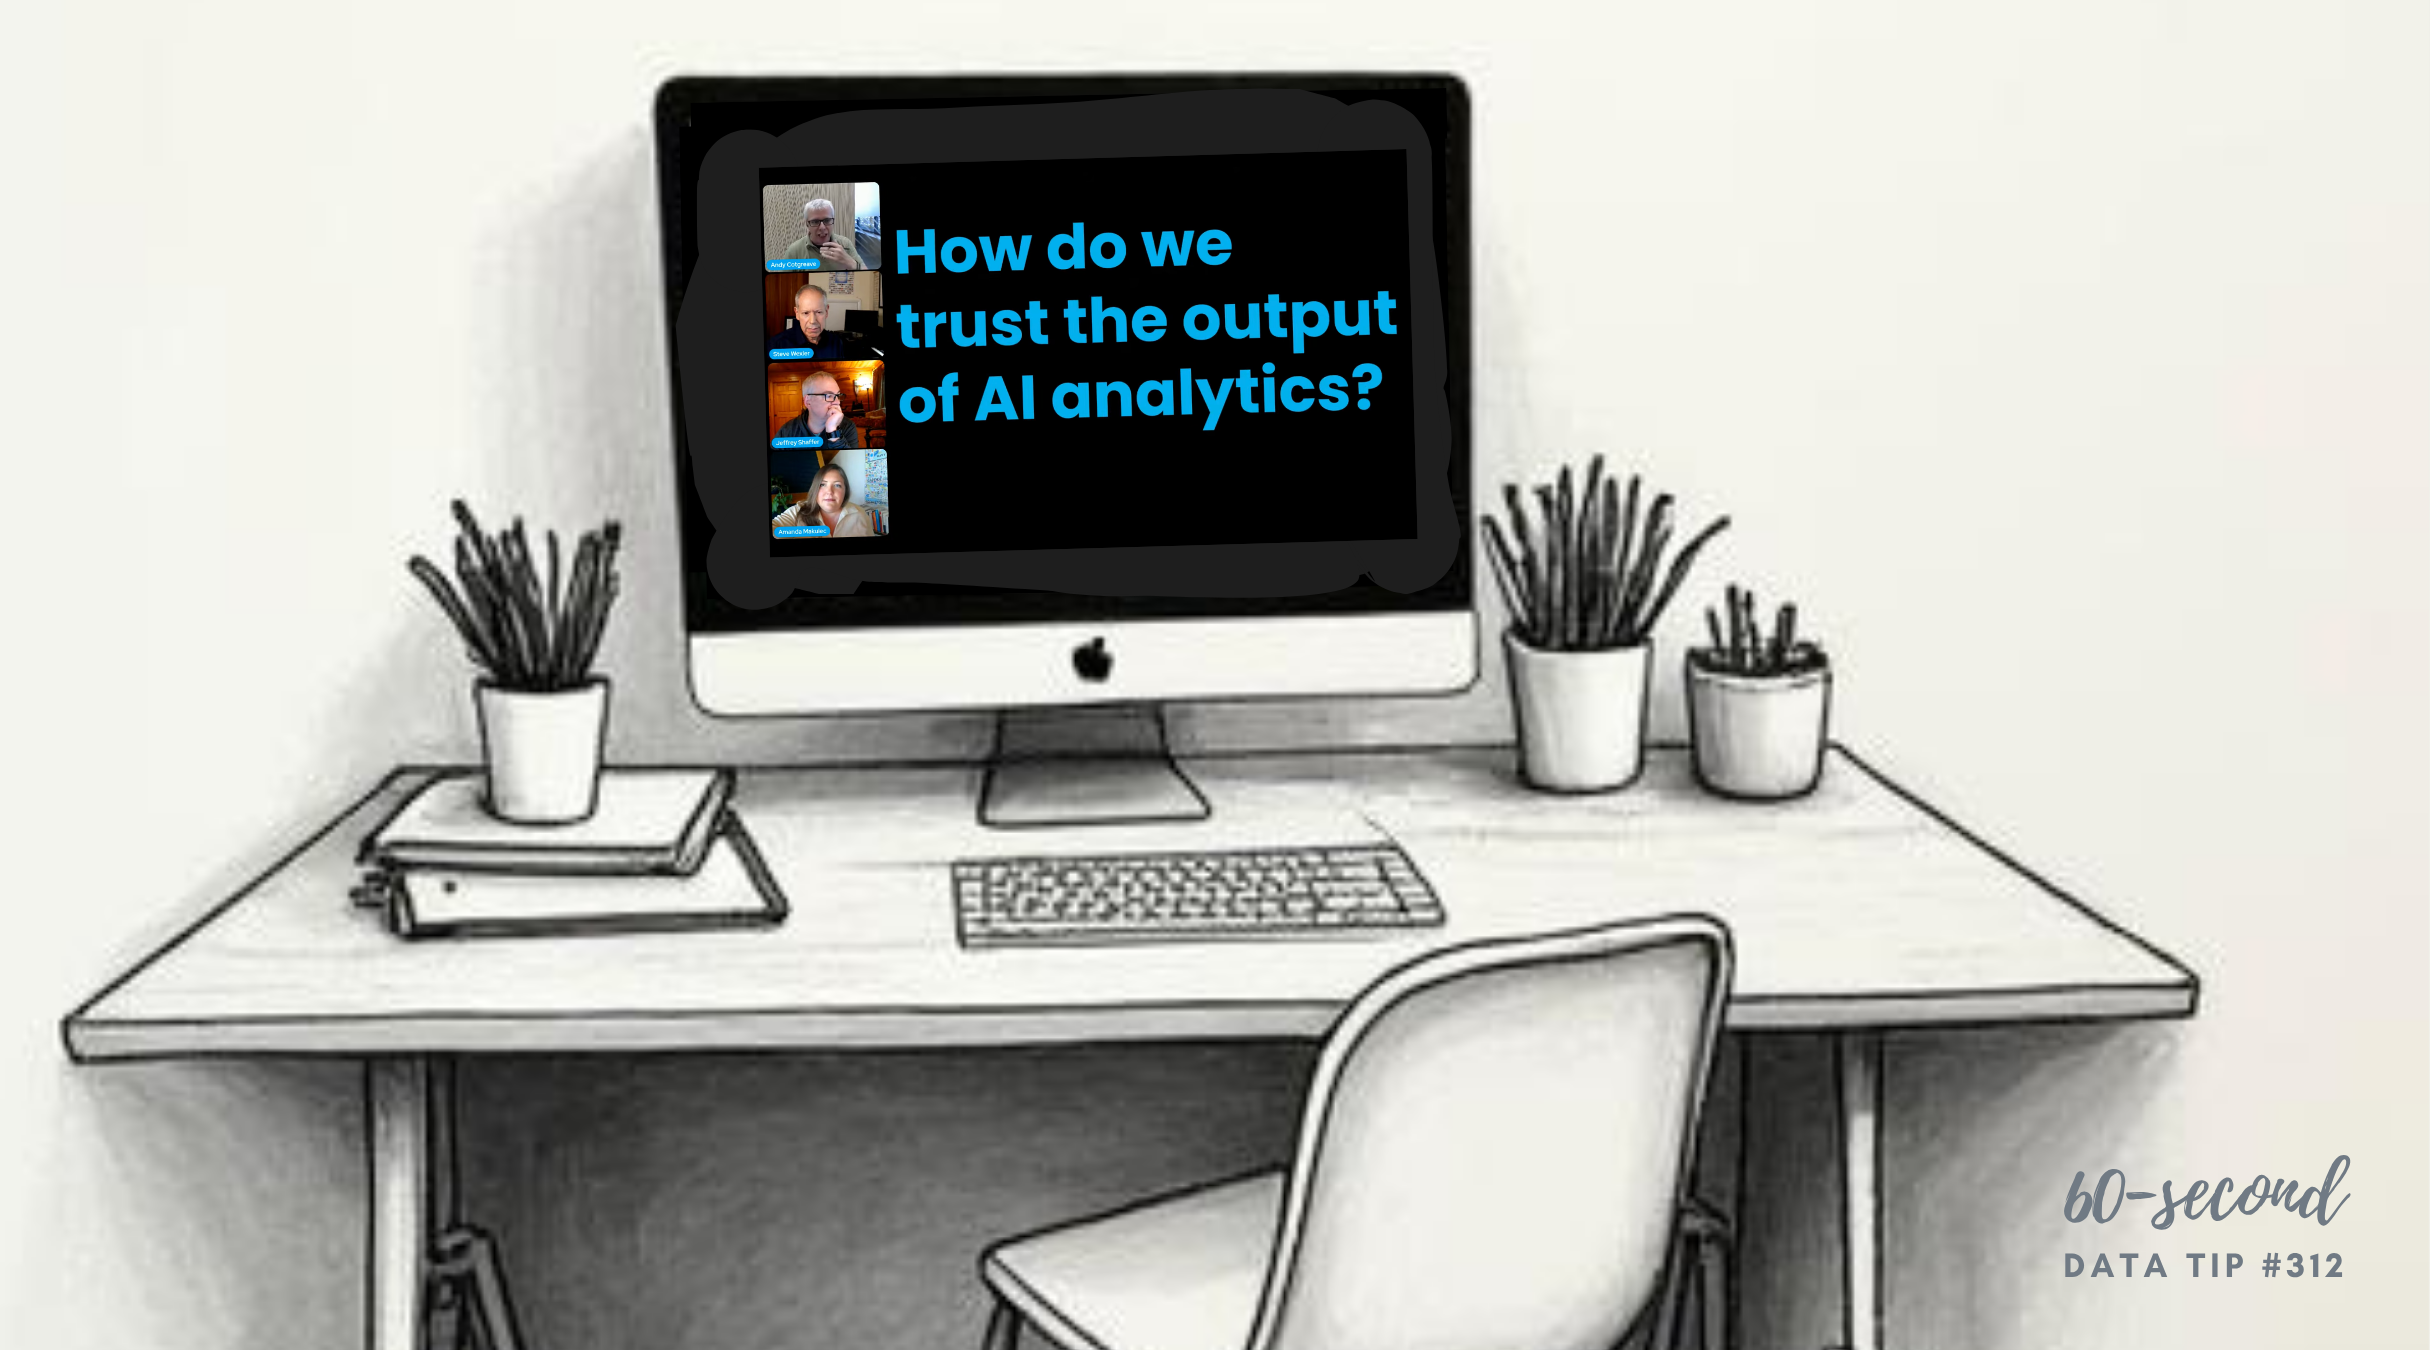
AI is in more than half of data viz workflows now. 58% of respondents reported using AI in their data visualization work in the past year, up from 37% the year before. But here’s what’s interesting: most are using it at the early stages of the process, for data prep, cleaning, and analysis, not for producing the visualizations themselves. That’s a useful frame for nonprofits thinking about where AI can actually help: less “make me a chart” and more “help me get this data into shape.”
The hardest part isn’t the chart. It’s the context. Two-thirds of respondents say it’s hard for colleagues to understand how much time a quality visualization takes. More than half say colleagues don’t understand that visualizations are more than decoration, that they’re analytical work. If that sounds familiar, you’re in good company. Even among dedicated data professionals, making the case for data visualization as serious work is an ongoing challenge. For nonprofits, where data viz competes with a hundred other priorities, naming this dynamic explicitly with leadership can help. A chart isn’t a finishing touch. It’s the analysis.
Source: Data Visualization Society, 2025 State of the Industry Report. The report is currently free to access, but free access closes around October 23 — after that it’s available to DVS Plus members only. If you’re reading this soon after it was posted, grab it now.
Let’s talk about YOUR data!
Got the feeling that you and your colleagues would use your data more effectively if you could see it better? Data Viz for Nonprofits (DVN) can help you get the ball rolling with an interactive data dashboard and beautiful charts, maps, and graphs for your next presentation, report, proposal, or webpage. Through a short-term consultation, we can help you to clarify the questions you want to answer and goals you want to track. DVN then visualizes your data to address those questions and track those goals.