
“Every artist gets asked the question: ‘Where do you get your ideas?’ The honest artist answers, ‘I steal them.’ . . . What a good artist understands is that nothing comes from nowhere. All creative work builds on what came before.” —Austin Kleon in Steal Like An Artist.
Today I offer up another steal-worthy interactive viz that I came across in the Tableau Public Gallery.
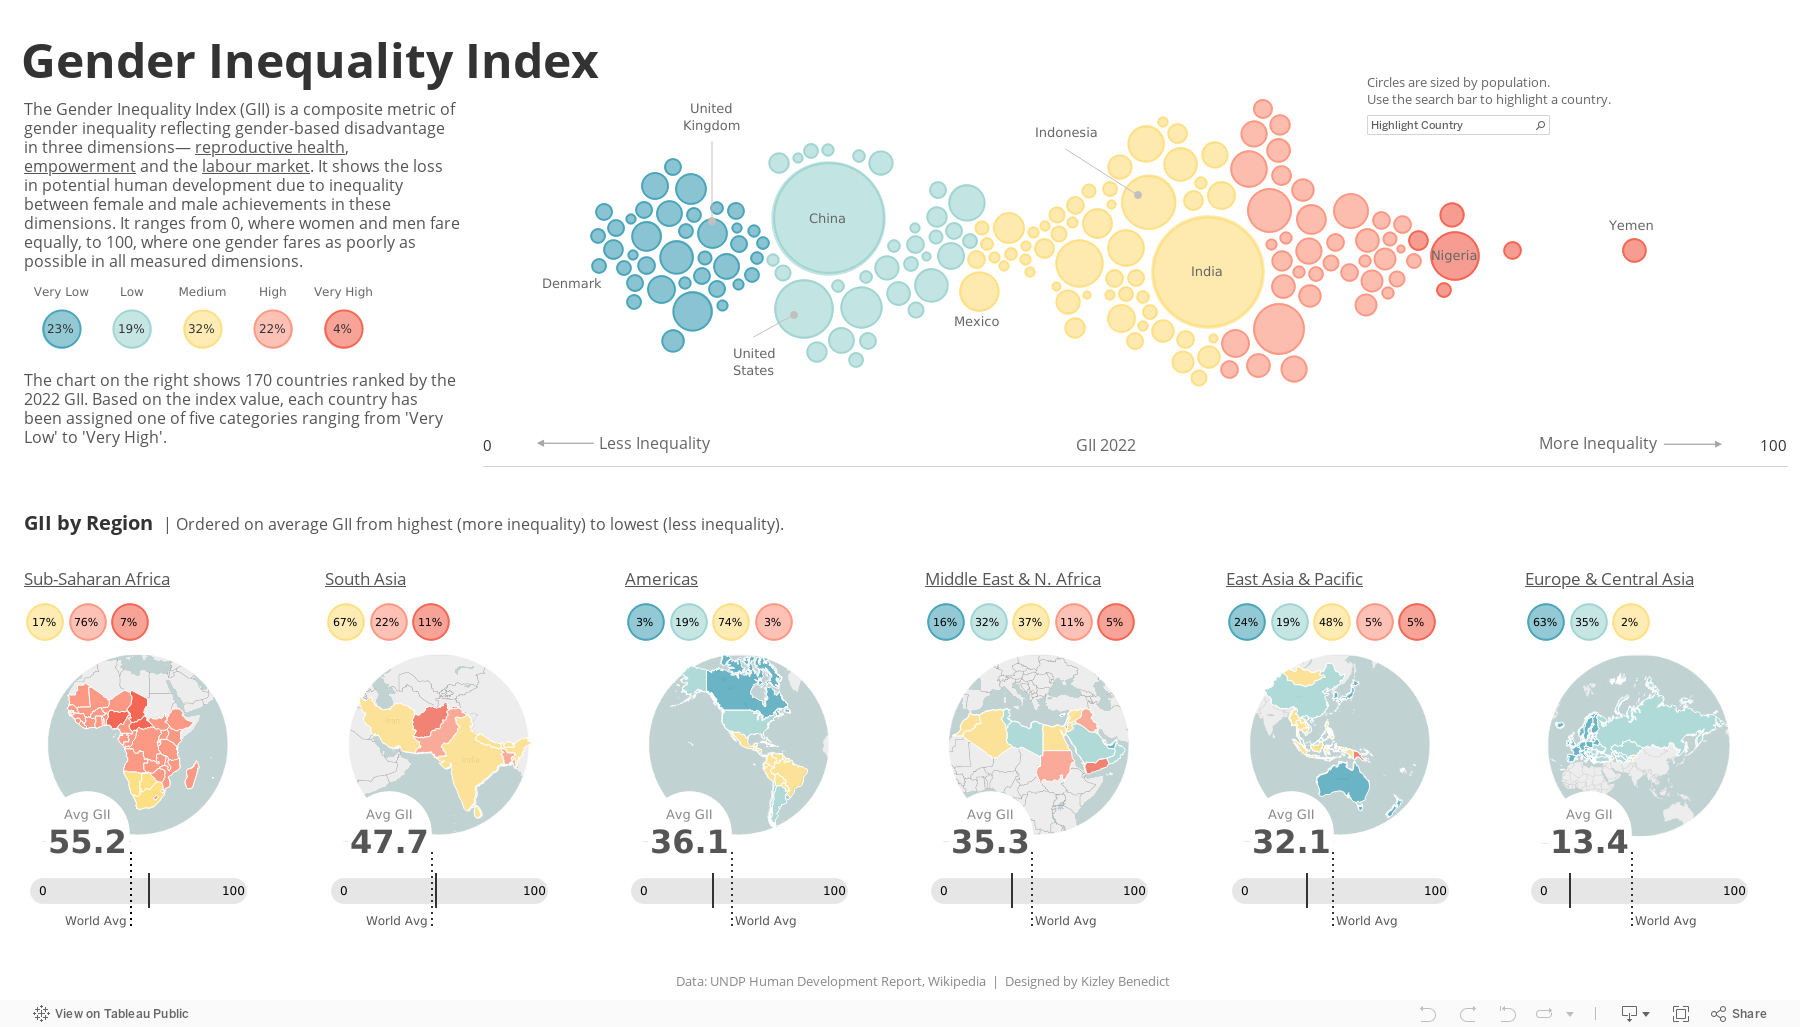
Source: Kizley Benedict on Tableau Public
Here’s what I suggest you steal from this viz:
Beeswarm Chart. The beeswarm chart at the top allows you to easily compare several countries and to see the overall distribution along the Gender Inequality Index among large and small countries. For more on beeswarm charts, see this tip.
Highlight a Country. For users who want to know about a particular country, the dashboard provides a search tool which highlights the selected country.
Overall Then Zoom In. After getting a sense of the overall distribution from the beeswarm chart, the user can zoom in and make comparisons among and within regions with the maps along the bottom of the dashboard.
To see past data tips, click HERE.
Let’s talk about YOUR data!
Got the feeling that you and your colleagues would use your data more effectively if you could see it better? Data Viz for Nonprofits (DVN) can help you get the ball rolling with an interactive data dashboard and beautiful charts, maps, and graphs for your next presentation, report, proposal, or webpage. Through a short-term consultation, we can help you to clarify the questions you want to answer and goals you want to track. DVN then visualizes your data to address those questions and track those goals.


