
If you are looking to compare individuals, programs, locations, events, etc. on one or more measures, a beeswarm chart could be just the ticket.
This is a new addition to a series of tips on different chart types. In each tip, l give you need-to-know information in a format akin to the “Drug Facts” on the back of medication boxes: active ingredients (what the chart is), uses (when to use it), and warnings (what to look out for when creating the chart). The idea is to fill up your toolbox with a variety of tools for making sense of data. To learn about other chart types, check out this index of data tips.
Active Ingredients (What is a beeswarm chart?)
A beeswarm chart (or swarmplot) is a type of data visualization that displays individual data points so that they don't completely overlap, resulting in a "swarming" effect. The beeswarm chart is related to strip plots and jittered strip plots, both of which are scatter plots with a measure on the vertical axis and a category on the horizontal axis. Strip plots become less useful when tightly packed data points start to overlap too much, obscuring patterns in the data. The jitter plot partly solves the problem but not as well as the beeswarm chart.
Uses
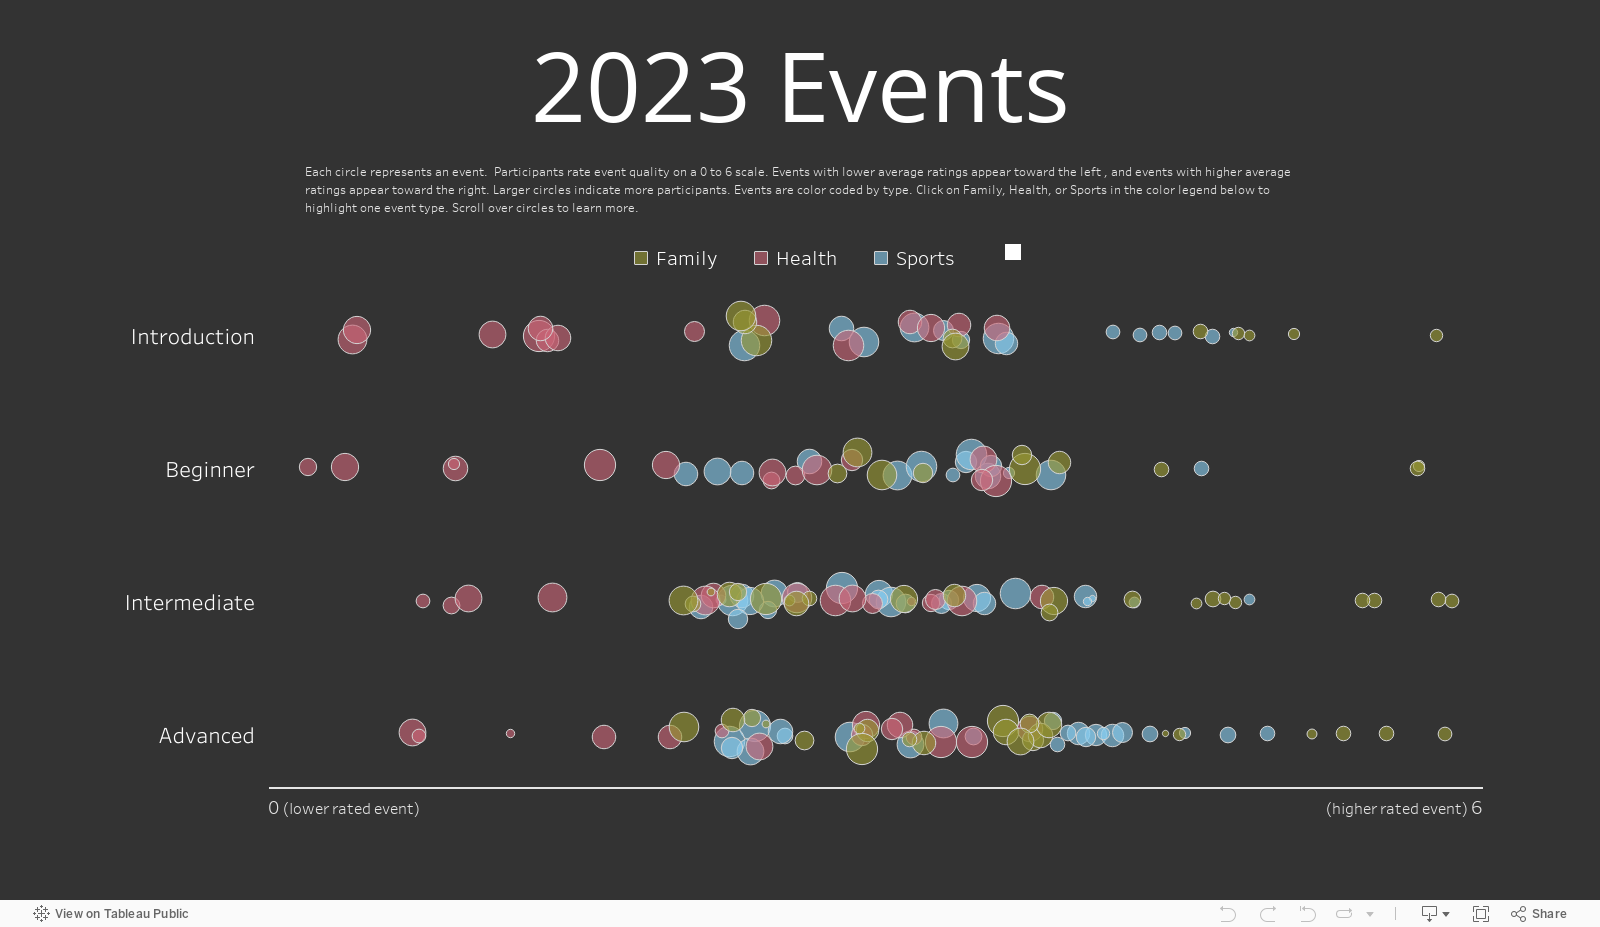
Beeswarm charts are useful to highlight individual categories or entities while still showing a distribution as a whole. In the example above, you can see that family events and smaller events were the most highly rated, while health events and larger events generally got lower ratings and that the distribution of average ratings was similar for introduction, beginner, intermediate, and advanced level events.
This type of chart is not native to most data viz applications but happily there is a free online tool called AdvViz that allows you to upload a CSV file to create a basic beeswarm chart and then download it as a Tableau file. From there, you can open it in Tableau Desktop and make adjustments to the formatting. That’s how I created the beeswarm chart above. You can also create this type of chart in Flourish and RAWGraphs.
Warnings
In the example above, I used color to distinguish different event types and circle size to show the number of participants in each event. When using color coding, make sure the colors contrast enough so that viewers can easily discern one category from another. Also, reducing the opacity of the color allows viewers to see overlapping circles. When using size to show a measure, make sure that the range of the measure is wide enough that the viewer can easily discern small from large. Small differences in size can be hard to detect.
Fun Fact
A beeswarm chart is a great way to show stressors on bee colonies! See chart below.

Source: Data Literacy
To see past data tips, including those about other chart types, scroll down or click HERE.
Sources: The Data Visualisation Catalogue
Let’s talk about YOUR data!
Got the feeling that you and your colleagues would use your data more effectively if you could see it better? Data Viz for Nonprofits (DVN) can help you get the ball rolling with an interactive data dashboard and beautiful charts, maps, and graphs for your next presentation, report, proposal, or webpage. Through a short-term consultation, we can help you to clarify the questions you want to answer and goals you want to track. DVN then visualizes your data to address those questions and track those goals.


