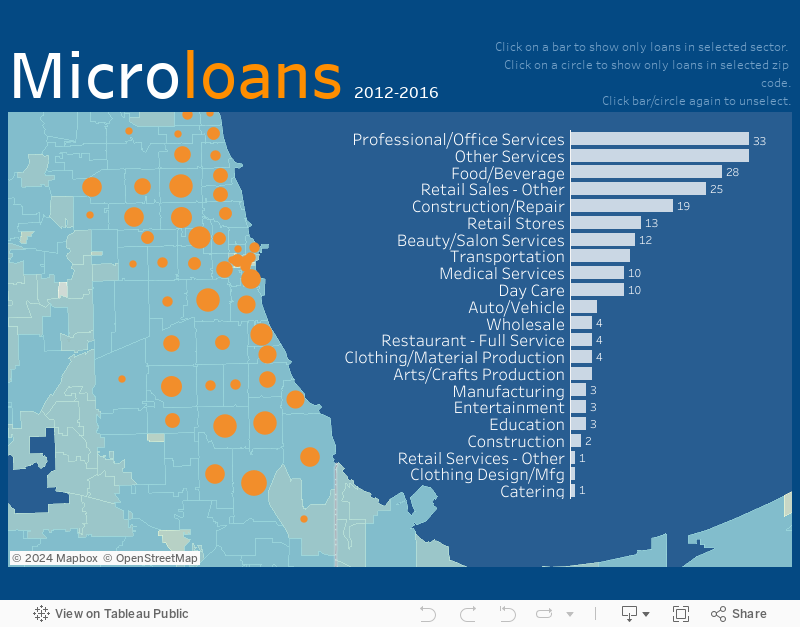
An interactive map is a great way to show donors, board members, prospective funders and other stakeholders whom you serve, including their age, location, income, and other characteristics. I’m doing a webinar on December 10, 2020 where I will teach you how to create an interactive map dashboard, like the one below, in less than an hour using Tableau Public, the free version of Tableau, a powerful data visualization tool. You can create a map dashboard with a simple Excel file, as long as it includes geographic data, such as zip codes. And you can embed the dashboard on your website, as I’ve done here. Play around with the dashboard below to explore the possibilities. And click HERE to register for the webinar.
Let’s talk about YOUR data!
Got the feeling that you and your colleagues would use your data more effectively if you could see it better? Data Viz for Nonprofits (DVN) can help you get the ball rolling with an interactive data dashboard and beautiful charts, maps, and graphs for your next presentation, report, proposal, or webpage. Through a short-term consultation, we can help you to clarify the questions you want to answer and goals you want to track. DVN then visualizes your data to address those questions and track those goals.


