
Point To The Story

Copy of 60-SECOND DATA TIP #8.png

Data can tell a story. But rarely is that story apparent when you look at a spreadsheet. (See Tip #1.) You can bring the story into focus by visualizing the data. You can show change over time using a line graph. You can compare and contrast groups using a bar chart. You can juxtapose a part of a group and the whole group using a pie chart. And there are plenty of other examples. But once you have visualized, the story can still be hidden, particularly to those unfamiliar with the data. That’s when it’s time to call out data points with color and annotations. In the visualization below, each line is a city in Hennepin County in Minnesota. The slope of the lines shows changes in housing prices overtime. The Minneapolis Star Tribune, which created the visualization, draws our attention to the city of St. Louis Park and allows us to easily compare this city's housing prices to that of other cities before and after the housing bubble peak. The annotation also gives us specific data on St. Louis Park that would be difficult to glean from the graph alone. The interactive version of this graph allows you to highlight different cities and look at median housing cost, relative cost, and relative change in cost.

See other data tips in this series for more information on how to effectively visualize and make good use of your organization's data.

Screen Shot 2017-12-13 at 10.37.27 AM.png

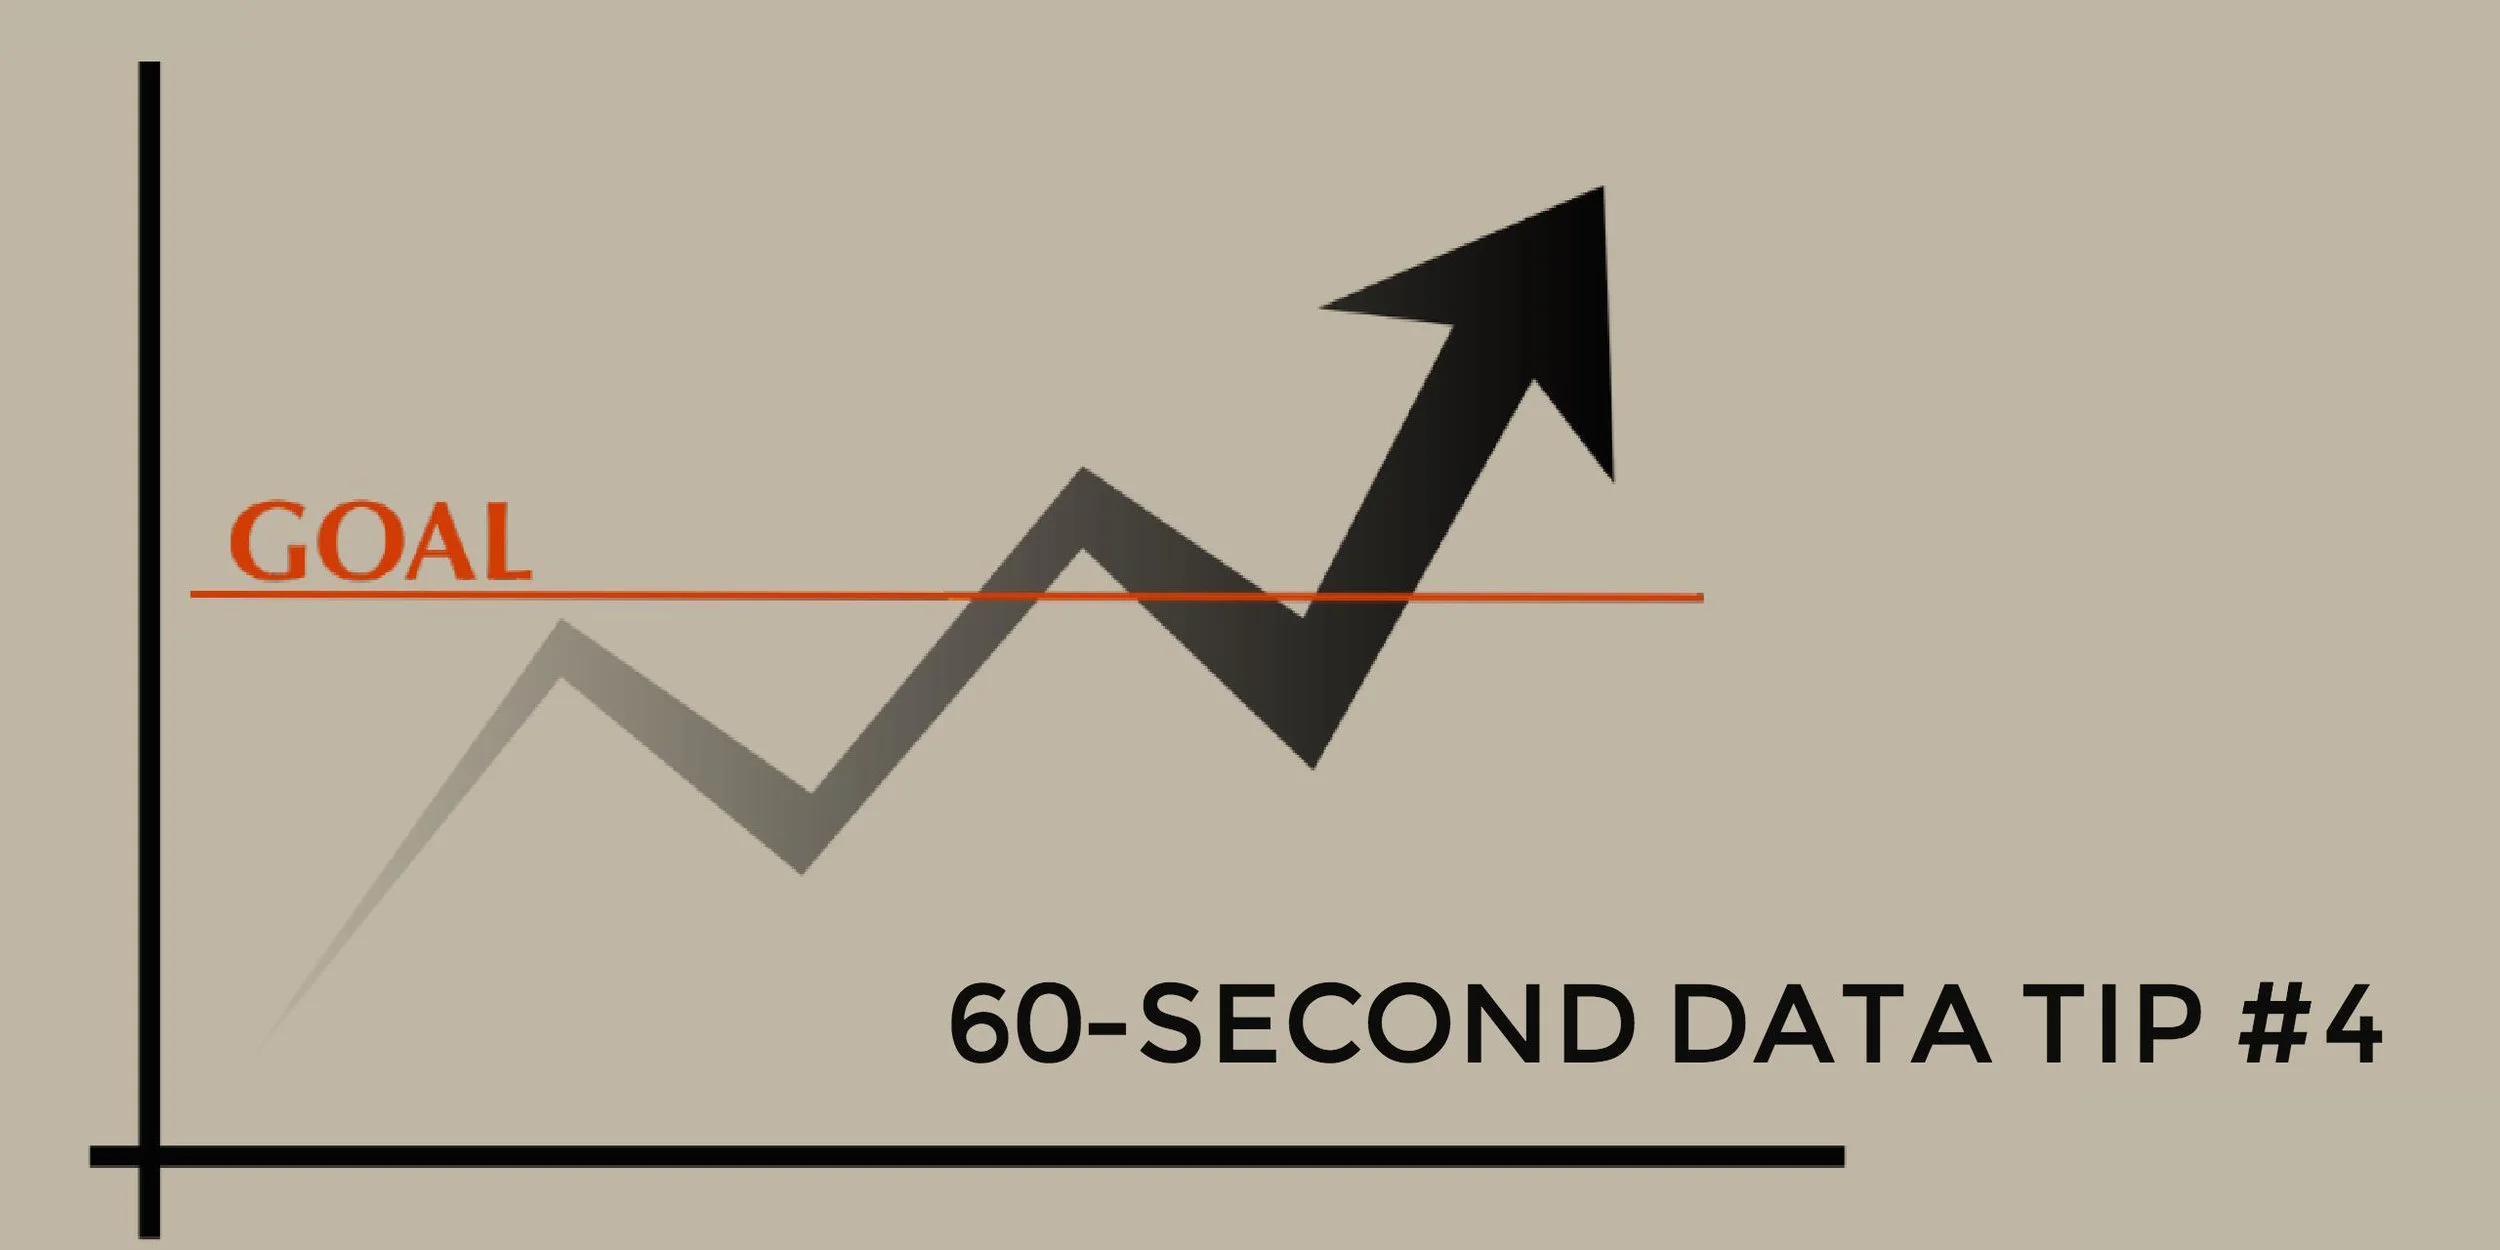
Don't Just Set Goals, Track Them

tip4.jpg

Many organizations go to a lot of trouble setting goals, eating up loads of staff and board meeting time, and then neglect to do one or both of the following:

  • Figure out how they will know if they are making progress toward their goals.

  • Track their progress toward their goals.

If your organization or program doesn’t already have clearly articulated goals, a logic model is a good first step toward setting them. Logic models show how resources, programs and services, and desired results relate to each other according to your organization’s strategic plan. (For more on logic models, check out the Pell Institute’s Evaluation Toolbook.)

You can set goals for any stage of the process: what resources you hope to garner, what services you intend to provide, or what outcomes you expect to see. The trick is to make these goals specific and measurable. Don’t say you will work strengthen a program, say that participation in the program will increase to 250 and that evaluation surveys will show average ratings at or above 4 (on a five point scale).

Once you set specific and measurable goals, don’t wait until you have all of the necessary data to visualize it. It’s important to bring the data to life for everyone involved, and that means showing it sooner rather than hiding it in spreadsheets and databases.

Even a simple line graph showing progress over time toward a goal will make your data perceptible, prompting you and your colleagues to ask yourselves important questions, such as: Is our data accurate? What additional data do we need to better understand the trends we see? What is going on in our program or our community or our field that might be affecting these trends? Questions like these can strengthen your resolve to gather new or better data as well as to make changes to enhance the efficacy of your program.

See other data tips in this series for more information on how to effectively visualize and make good use of your organization's data. 

Image Source: Pixabay.com

(This data tip originally appeared on Philanthropy News Digest’s PHILANTOPIC blog.)