How To Make Your Data Viz More Accessible: Screen Readers and Keyboard Navigation

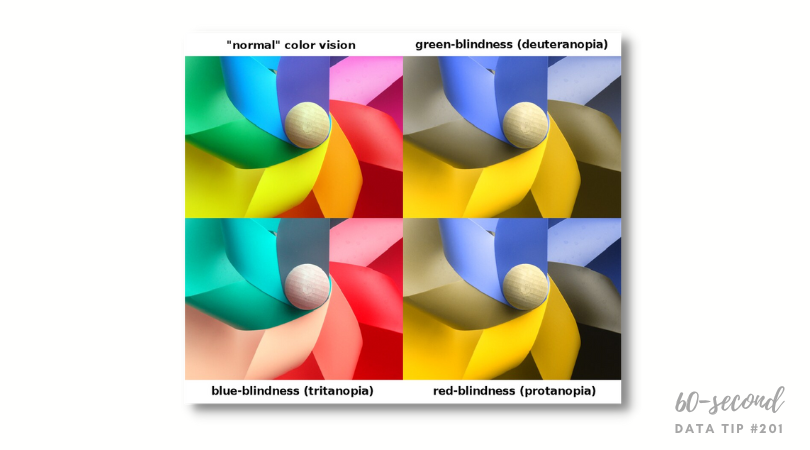
In a series of 60-second data tips, I’m taking on one basic accessibility issue at a time. This week it’s about screen readers and keyboard navigation. We do not all perceive in the same way. Some people with vision or physical limitations, navigate charts, graphs, and maps using only the keyboard (no mouse) and screen readers to understand the content.

A screen reader is an assistive technology primarily used by people with vision impairments. It converts text, buttons, images and other screen elements into speech or braille. Here’s one in action:

Source: Highcharts on YouTube

You can make your data visualizations more screen reader- and keyboard-friendly by doing the following:

1) Understand the capabilities of the tool you use to create visualizations.

Some simple Googling can help you to figure this out. For example, if you use Tableau, this page explains that once you publish and embed a Tableau dashboard into a web page that conforms to Web Content Accessibility guidelines (WCAG 2.0 AA), screen readers should be able to interpret them. Further, dashboards created in Tableau 2021.3 and later have a default top-to-bottom, left-to-right “focus order” (i.e. the order in which elements of a visualization are narrated by a screen reader).

2) Reduce the number of marks in visualizations.

Marks are the visual elements used to represent data in a chart, graph, or map. Think bars, lines, circles, etc. When there are a lot of marks, it can be difficult to understand a visualization using a screen reader. You can reduce the number of marks by:

  • Including only the most important data points,

  • Aggregating data points into groups (e.g. rather than showing the population of 40 cities with 40 bars, you could group them into small, medium, and large cities and show just three bars representing the average population for each group), and

  • Adding filters that allow the user to see fewer data points at a time.

3) Add text that clarifies the content of the visualization

Titles, subtitles, captions, and legends make a visualization more accessible to everyone including those using screen readers.

If you are interested in a deep dive into accessibility issues and solutions, you can find plenty of information online including Chartability.

To see past data tips, click HERE.


Let’s talk about YOUR data!

Got the feeling that you and your colleagues would use your data more effectively if you could see it better? Data Viz for Nonprofits (DVN) can help you get the ball rolling with an interactive data dashboard and beautiful charts, maps, and graphs for your next presentation, report, proposal, or webpage. Through a short-term consultation, we can help you to clarify the questions you want to answer and goals you want to track. DVN then visualizes your data to address those questions and track those goals.


How To Make Your Data Viz More Accessible: Color Blindness

In a series of 60-second data tips, I’m taking on one basic accessiblity issue at at time. This week it’s color. About 1 in 20 people have color blindness meaning that two colors which appear distinct to a person with normal color vision may appear to be the same to a person with color blindness. There are different types of color blindness (as shown above), but the most common is red/green color blindness (aka deuteranopia). Becasuse color plays an important role in many data vizes by drawing attention to certain trends, distinguishing among categories, or illustrating relationships, we should be careful in choosing colors to make our visualizations accessible to more people.

Some data viz tools, such as Tableau, have built-in colorblind palettes. You can also generate an accessible color palette using an online generator like this one from Venngage.

If you are interested in a deep dive into accessibility issues and solutions, you can find plenty of information online including Chartability.

To see past data tips, click HERE.

Sources: Coloring for Colorblindness, Build Accessible Dashboards by Tableau, Accessible color palette generator by Venngage


Let’s talk about YOUR data!

Got the feeling that you and your colleagues would use your data more effectively if you could see it better? Data Viz for Nonprofits (DVN) can help you get the ball rolling with an interactive data dashboard and beautiful charts, maps, and graphs for your next presentation, report, proposal, or webpage. Through a short-term consultation, we can help you to clarify the questions you want to answer and goals you want to track. DVN then visualizes your data to address those questions and track those goals.


What's The Right Text Size to Make Data Viz Accessible?

Here’s another in a series of tips on how to make data visualizations accessible to audience members with issues that affect their ability to see or interact with a visualization. This week it’s text size.

The rule of thumb is: Text must not be smaller than 9 point in size. Ideally only minor text is rendered at 9 point (e.g. axis labels) while all other text is larger. The viz below has a lot of text, and most of it is 9 point. To increase its accessibility, I might increase the key sentences in the captions to 11 point. But, at the least, I’d bump up the 8 point text, near the bottom, to 9 point, which is what you see in the “After” version below.

If you are interested in a deep dive into accessibility issues and solutions, you can find plenty of information online including Chartability.

To see past data tips, click HERE.


Let’s talk about YOUR data!

Got the feeling that you and your colleagues would use your data more effectively if you could see it better? Data Viz for Nonprofits (DVN) can help you get the ball rolling with an interactive data dashboard and beautiful charts, maps, and graphs for your next presentation, report, proposal, or webpage. Through a short-term consultation, we can help you to clarify the questions you want to answer and goals you want to track. DVN then visualizes your data to address those questions and track those goals.


How To Make Your Data Viz More Accessible, Tip#1

If you are trying to reach a large audience with your charts, maps, and graphs, then consider accessibility issues. Even if your data viz is meant for a small, specific audience, you may not be aware that certain people in the group are, for example, color blind or have other issues that affect their ability to see or interact with a visualization.

If you are interested in a deep dive into accessibility issues and solutions, you can find plenty of information online including Chartability. In a series of 60-second data tips, I’m taking on one basic accessibility issue at at time. This week it’s contrast.

Data visualizations must be perceivable to be accessible. This means that users can readily identify content using their senses: sight, sound, and touch. When the contrast between the critical content and the background or adjacent colors is low, the content can be difficult to perceive for some people. So shapes and large text should have more than a 3:1 contrast against background or adjacent content, and regular text should have more than a 4.5:1 contrast. Here’s a tool to determine contrast ratio.

The colors in the first stacked bar chart below have low contrast to each other (less than 2 to 1) and so some may have difficulty distinguishing among the bar segments. The second stacked bar chart, by contrast (pun intended), has a higher ratio (3 to 1) and thus is much easier to perceive.

To see past data tips, click HERE.


Let’s talk about YOUR data!

Got the feeling that you and your colleagues would use your data more effectively if you could see it better? Data Viz for Nonprofits (DVN) can help you get the ball rolling with an interactive data dashboard and beautiful charts, maps, and graphs for your next presentation, report, proposal, or webpage. Through a short-term consultation, we can help you to clarify the questions you want to answer and goals you want to track. DVN then visualizes your data to address those questions and track those goals.