
This is a new addition to a series of tips on different chart types. In each tip, l give you need-to-know information in a format akin to the “Drug Facts” on the back of medication boxes: active ingredients (what the chart is), uses (when to use it), and warnings (what to look out for when creating the chart). The idea is to fill up your toolbox with a variety of tools for making sense of data. This time I give you the sunburst chart.
Active Ingredients (What is a sunburst chart?)
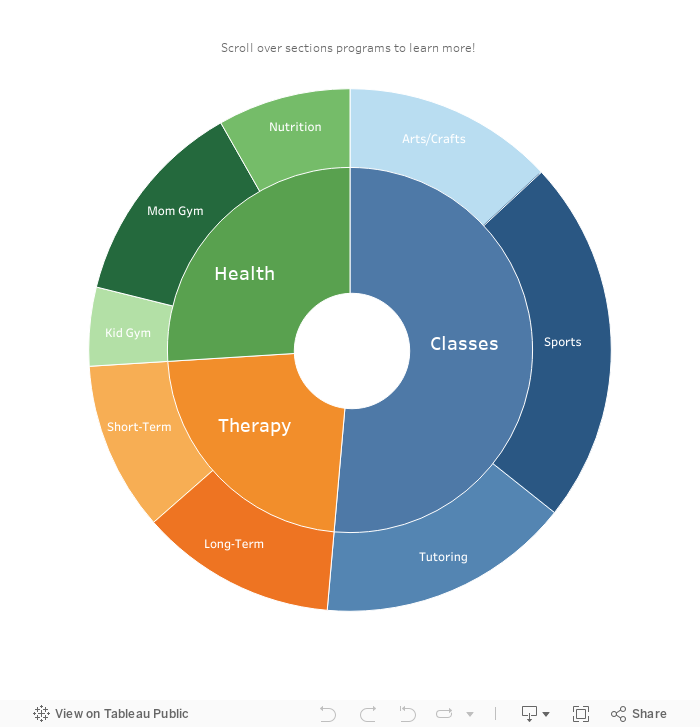
A sunburst chart is a multi-level pie chart. Each ring corresponds to a level in a hierarchy, with the highest level as the inner circle or ring. Each ring slice is either divided equally under its parent slice or is proportional to a value. Color is often used to highlight hierarchal categories. Check out the example below. The inner ring segments show the number of participants in three program areas of a community center. The outer ring segments shows the number of participants in specific programs within the three areas. Scroll over segments to learn more.
Uses
Although the pie chart gets a bad rap in the data viz world, this pie chart cousin shines in certain circumstances. It works best (in my opinion) when you want to show not only a hierarchy but also how each component of the hierarchy differs according to some measure. For example, you want to show which components have the most participants or funding, or the highest survey ratings.
Here are instructions for creating a sunburst chart with Tableau and Excel.
Warnings
Sunburst charts with a large number of ring slices are difficult to read. A good rule of thumb is to abandon your dreams of a sunburst chart if any of the segment slices are too small to label. Once you need a color legend, as in the example below, use another type of chart such as a tree diagram or treemap. Also, I think a tree diagram works better when you are just showing a hierarchy and not how the components differ according to a measure.
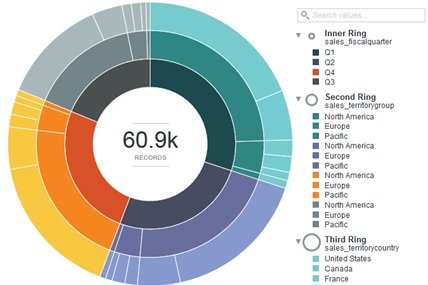
Source: Oracle
Fun Fact
Here’s an early example of a sunburst chart, published in Mechanical Engineering in 1921 according to Think Design. It shows the average annual net expenditure of the US federal government from 1910 to 1919.
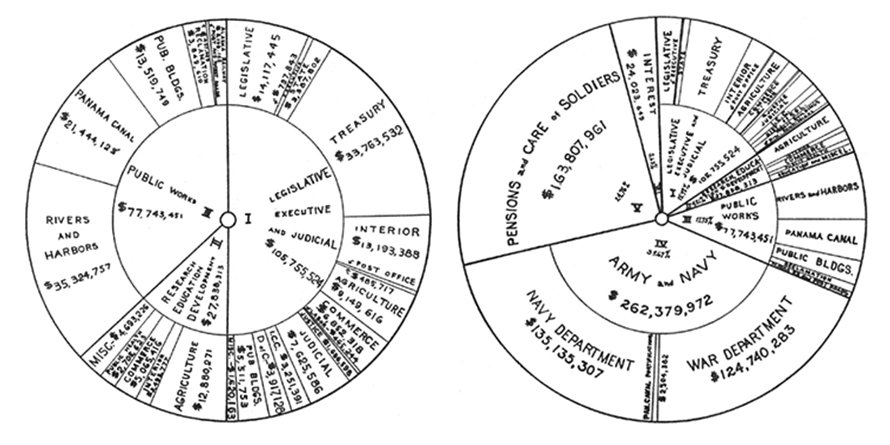
Source: Think Design
Let’s talk about YOUR data!
Got the feeling that you and your colleagues would use your data more effectively if you could see it better? Data Viz for Nonprofits (DVN) can help you get the ball rolling with an interactive data dashboard and beautiful charts, maps, and graphs for your next presentation, report, proposal, or webpage. Through a short-term consultation, we can help you to clarify the questions you want to answer and goals you want to track. DVN then visualizes your data to address those questions and track those goals.


