
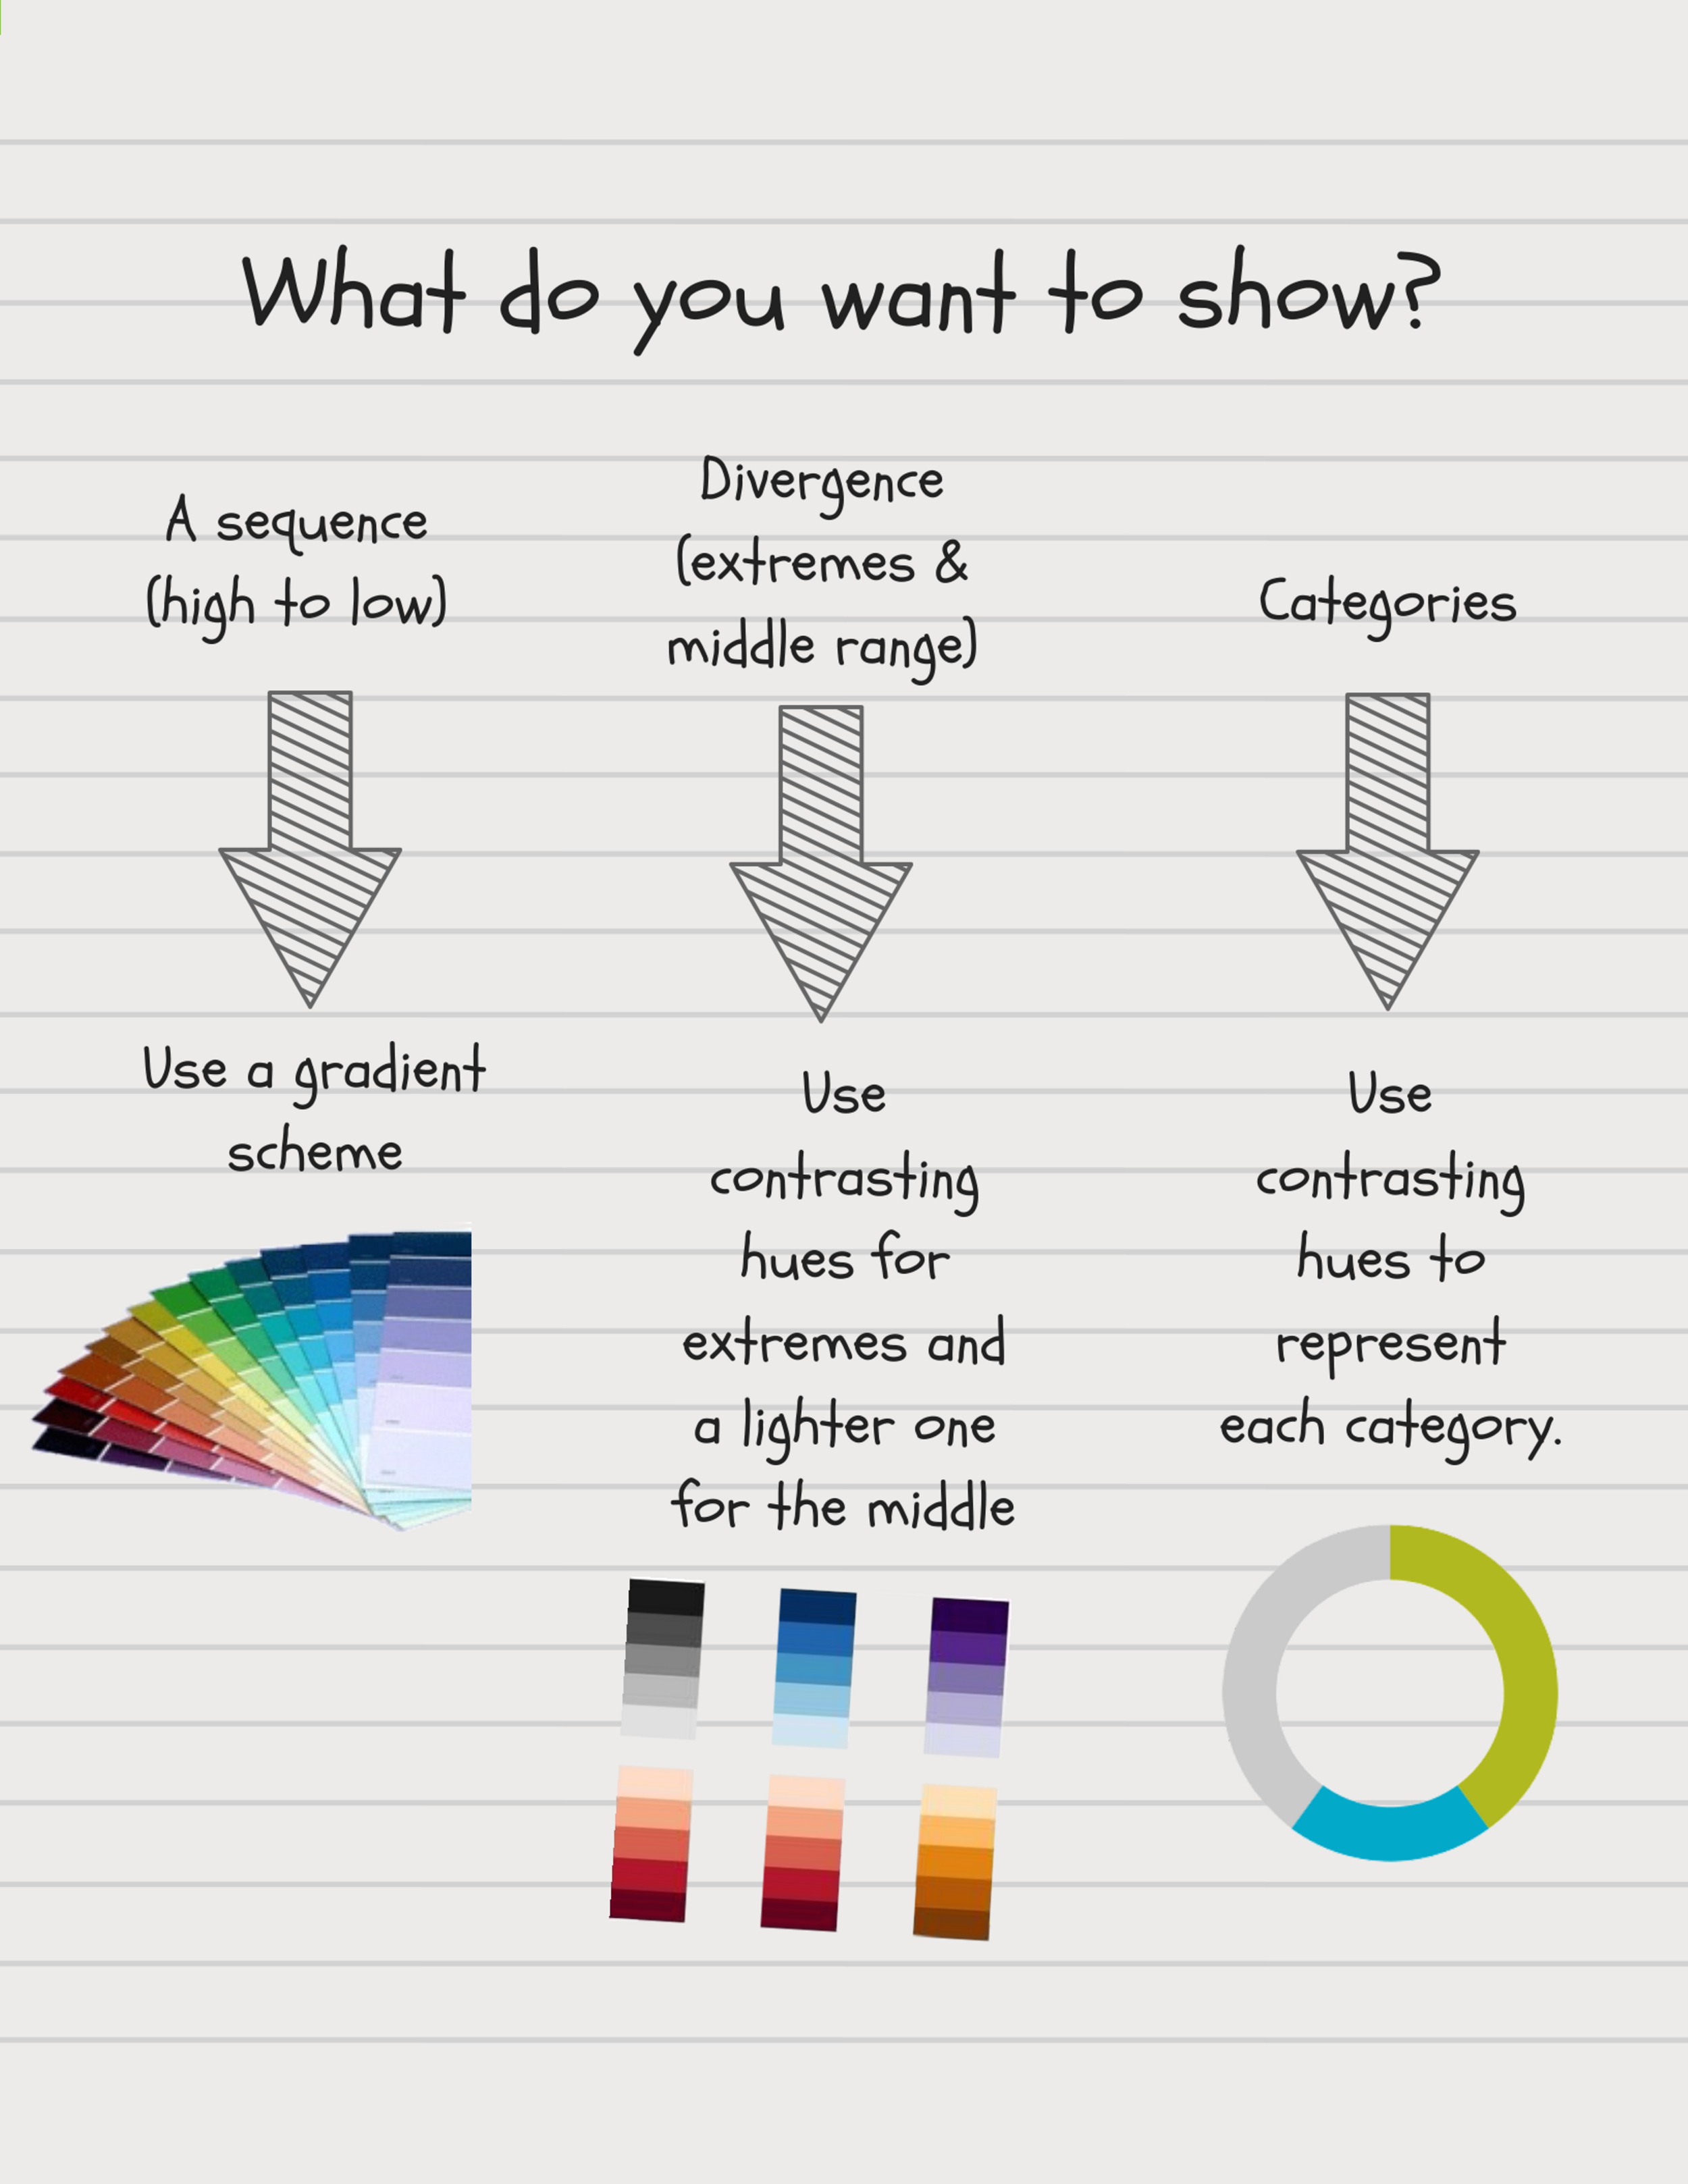
Bad color decisions can break an otherwise effective data visualization. In Data Tip #14, I gave you some color dos and don'ts. Today, I offer a simple flow chart to help you choose the right type of color scheme for your viz, based on what you want to show.
See other data tips in this series for more information on how to effectively visualize and make good use of your organization's data.