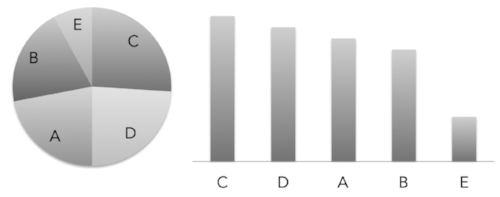
In honor of the upcoming pie-focused holiday, I am revisiting the pie chart. You’ve heard me (and perhaps countless others) disparage the pie chart. Humans, as you may recall, are not so good at distinguishing between different angles. And pie slices involve angles. We are better at assessing length along a common scale. So it’s much easier to figure out which bar in the bar chart below is longest than it is to determine which pie slice is largest.
Data viz gurus will tell you to only use the pie chart to show part-to-whole relationships. Like this one showing what percentage of all pie lovers love minced meat pie (data source: my imagination).
But I’m going to push back against the data viz orthodoxy a bit. Because I think there are two types of angles we are really good at assessing: the 90-degree angle and the 180-degree angle. Moreover, when we use those angles to divide a circle, we instantly perceive one-quarter and one-half, respectively. Nothing says “a quarter” like a quarter slice of pie. But show me quarter of a tray of brownies? Well, one-fourth is probably not your first thought.
Indeed, we are so good at one-half and one-quarter assessments, that we can immediately detect when a slice slightly misses the mark.
But it’s more difficult when comparing bars. Can you tell which bar below is divided 75/25 and which is 73/27?
So consider a pie chart (or it’s close cousin the donut chart) when:
Showing how the size of one or two groups relates to the whole group
Showing group sizes that equal one-half or one-quarter of the whole
Showing when a group size is slightly more or less than one-half or one-quarter of the whole
And during Thanksgiving, just consider pie, regardless of the shape and size of the slice.
(I know I promised you more on making data beautiful last week. Stay tuned for that tip in the upcoming weeks.)
See other data tips in this series for more information on how to effectively visualize and make good use of your organization's data.
Photo by Chloe Benko-Prieur on Unsplash
Photo by Alison Marras on Unsplash


